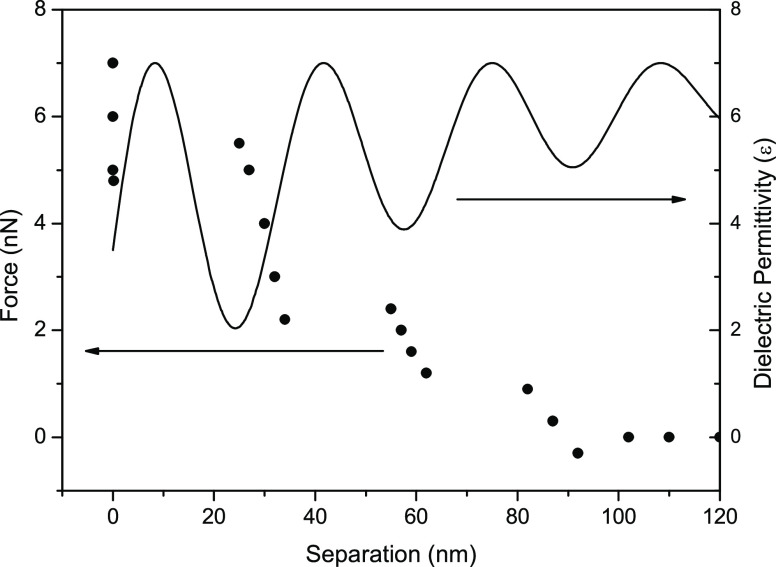
Figure 8.
Force vs distance profile of an interfacial region with three clusters. The full line shows the adjusted oscillating profile of the dielectric permittivity calculated using eq 1. For the interval x = 0 up to x ≅ 25 nm there is an attractive force acting on the tip. Regions corresponding to attraction have ε > 7, and regions corresponding to repulsion have ε < 7.

