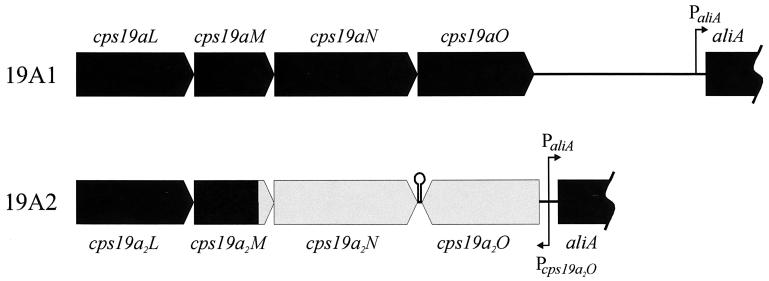
FIG. 4.
Diagrammatic representation of the cps19aL-aliA regions of cps19a and cps19a2. The black region of cps19a2 is >90% identical to the same region in cps19a, and the grey region exhibits 75 to 80% identity to the equivalent regions in cps19a. The positions of the potential promoter sequences and the putative stem-loop terminator are also indicated.

