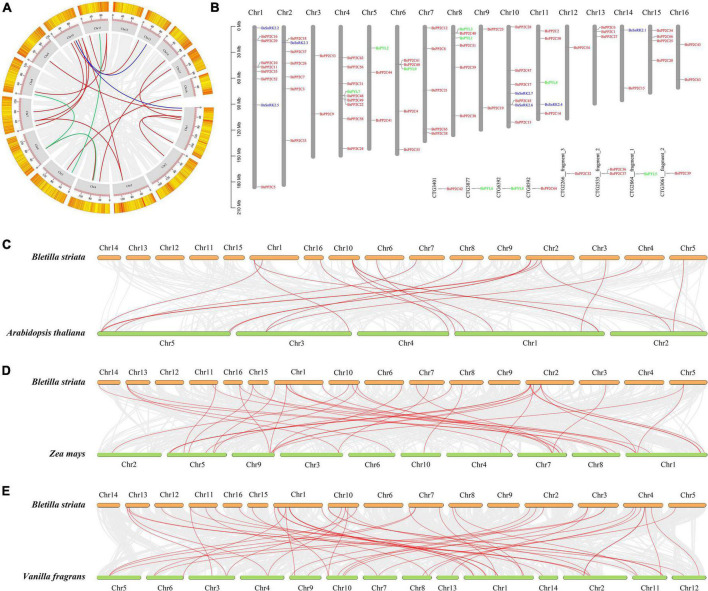
FIGURE 3.
Chromosomal localization and collinearity analysis of BsPP2Cs, BsPYLs, and BsSnRK2s gene families. For intraspecific collinearity analysis (A) and chromosomal localization (B), gray boxes (gray columns in panel B) represent the 16 pseudochromosomes of B. striata, and red, green, and blue lines represent collinear relationships and localization in BsPP2Cs, BsPYLs, and BsSnRK2s gene families, respectively. Interspecific collinearity analysis of BsPP2Cs, BsPYLs, and BsSnRK2s between B. striata and A. thaliana (C), Z. mays (D), as well as V. fragrans (E). Red lines represent collinear relationships of orthologous gene pairs.

