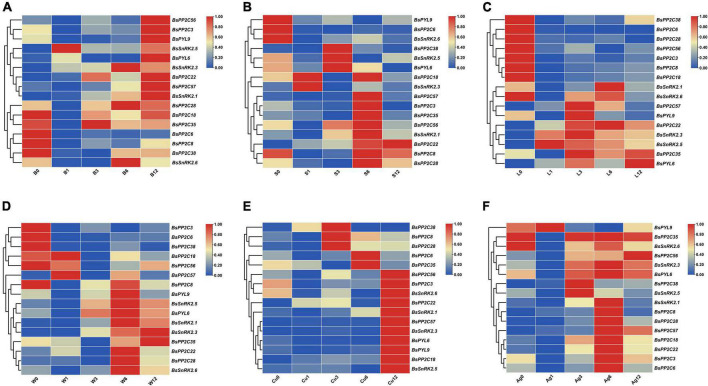
FIGURE 5.
Expression profile heatmap with hierarchal clustering of selected two BsPYLs, ten BsPP2Cs, and four BsSnRK2s genes in response to different stress treatments for 0, 1, 3, 6, and 12 h, including ABA (A, B0–B12), SA (B, S0–S12), low temperature (C, L0–L12), wounding (D, W0–W12), CuSO4 (E, Cu0–Cu12), and AgNO3 (F, Ag0–Ag12). The relative expression for each genes is depicted by color intensity in each field. Higher values are represented by red whereas lower values are represented by blue.

