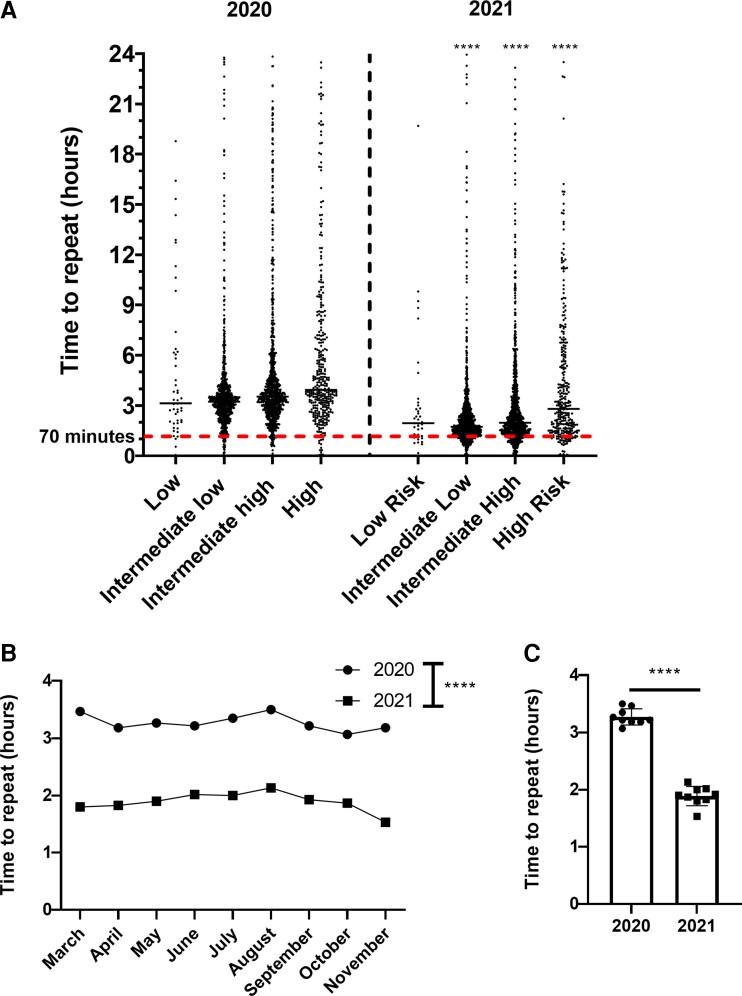
Figure 3.
Time to repeat troponin measurement in 2020 vs. 2021. (A) Spread of data for time to repeat troponin stratified by initial troponin measurement. (B) Time to repeat troponin stratified by month. (C) Overall time to repeat troponin measure, where time is are averaged by month. Time (hours) on the y axis, with the median and spread of individual datapoints displayed as appropriate. Data not normally distributed, determined using the Shapiro–Wilk test. Statistical analysis was performed with two-way ANOVA for (A and B) with Tukey’s post hoc and significance for 2021 vs. 2020 is displayed on the graph for each risk category for (A). For (C), significance determined using Mann–Whitney U test.

