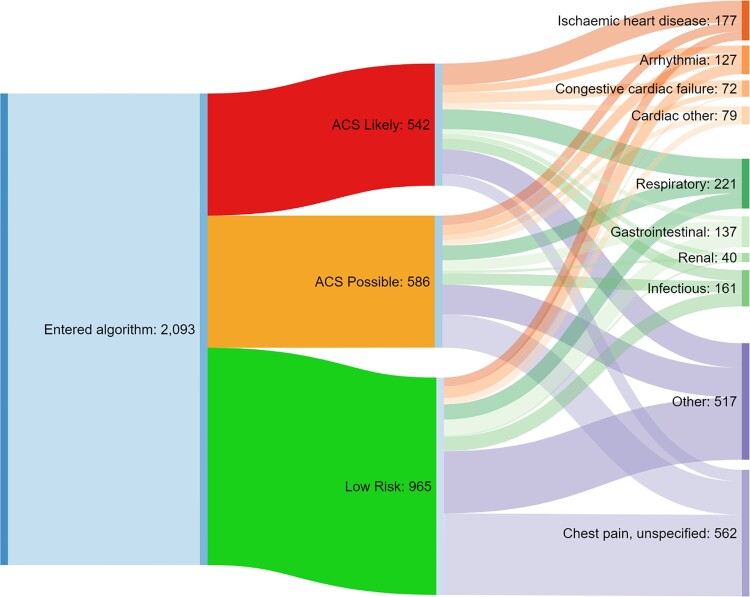
Figure 4.
Schematic representation of triage by troponin and ultimate discharge diagnosis. Shown is the number of patients entering the ACS algorithm (left), the rapid risk stratification performed (middle), and discharge diagnoses (right). Data summarized from discharge diagnoses in Supplementary material online, Table S1. ‘Respiratory’ includes ‘Pulmonary embolism’, ‘Obstructive airway disease’, and ‘Respiratory other’. ‘Infectious’ includes the ‘Infectious’ category in Table 4 and ‘COVID’. ‘Other’ includes the ‘Other’ category in Supplementary material online, Table S1 and ‘Musculoskeletal’.

