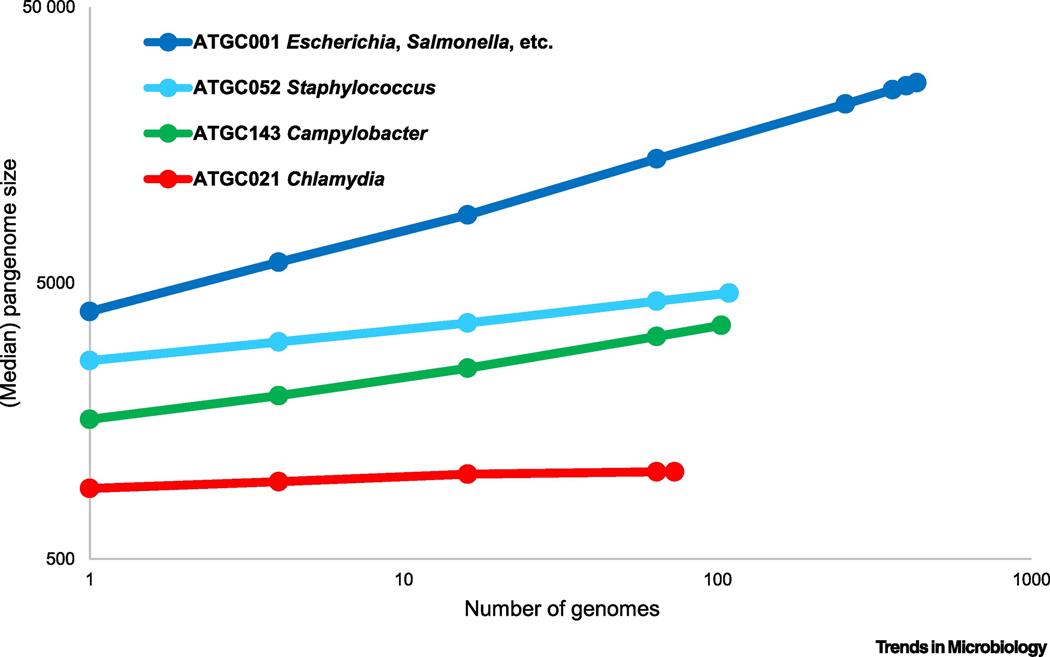
Figure 2. Pangenomes of prokaryotes.
The plot (rarefaction curves; double logarithmic coordinates) show the increase in the total number of genes with the addition of new genomes for four clades of closely related bacteria. The points show the medians of the numbers of families of orthologous genes in 100 randomly sampled subsets of genomes within a clade. The clades represent four bacterial clusters from Alignable Tight Genome Clusters databse (ATGCs) [95]. ATGC001 is a cluster of 432 genomes from Escherichia, Salmonella, Enterobacter and other closely related families; ATGC052, 109 genomes of Staphylococcus aureus and S. argenteus; ATGC143, 103genomes of Campylobacter jejuni and C. coli; ATGC021, 73 genomes of Chlamydia trachomatis and C. muridarum.

