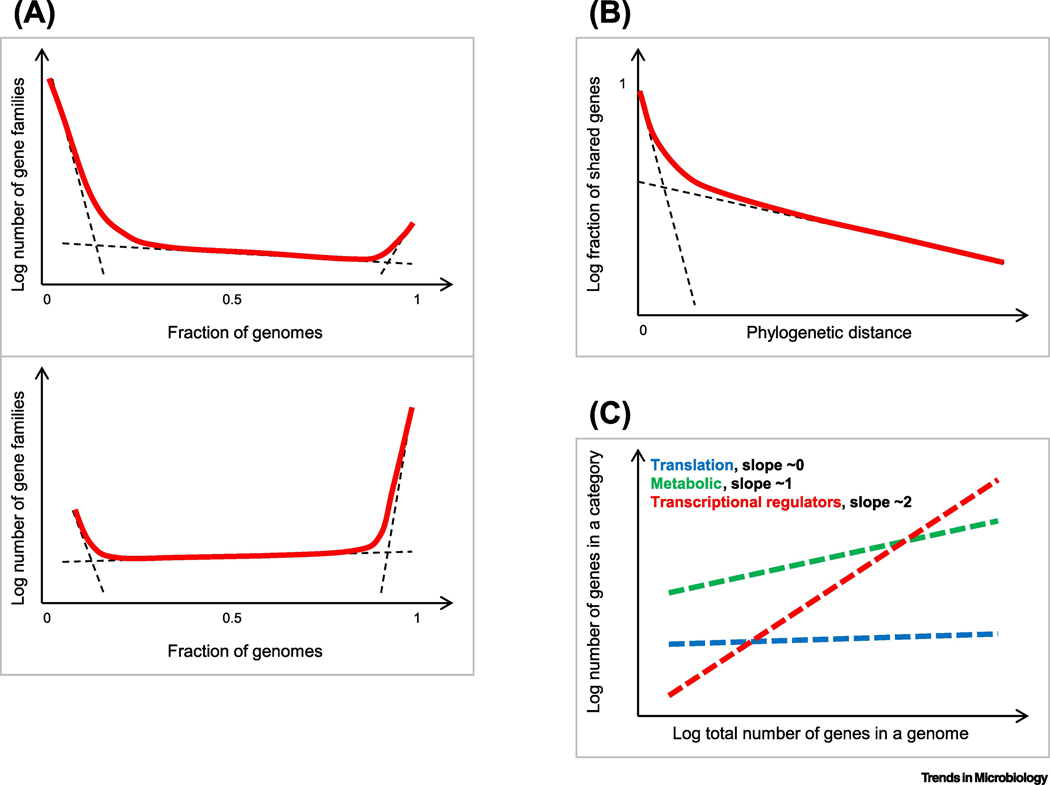
Figure 3. Quantitative laws of prokaryote genome evolution.
The schematic plots show: A. The universal gene commonality distribution. Top: prokaryote domains level (across multiple phyla); bottom: ATGC level (across closely related species or genera) [95]. Dashed lines show the approximate contributions of the individual components (cloud, shell and core); the solid line shows the observed combined distribution.
B. Two classes of prokaryote genes with slow and near-instantaneous replacement rates. Dashed lines show the exponential decay of the fast- and slow-decaying components; the solid line shows the observed combined fraction of gene families that are shared at different evolutionary distances.
C. Differential scaling of functional classes of prokaryote genes with the total number of genes in a genome

