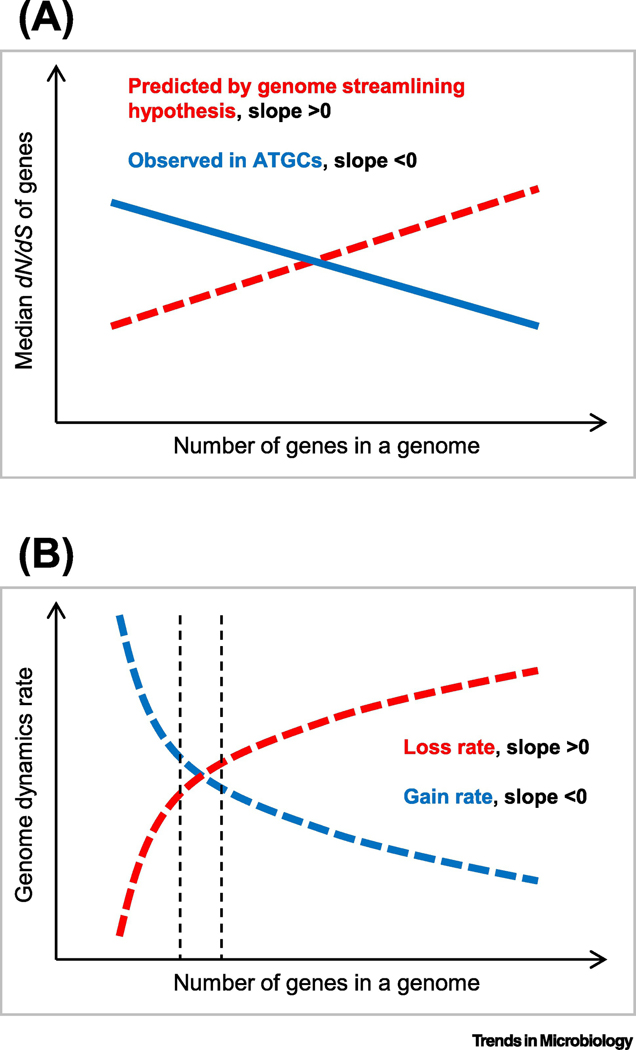
Figure 4. Selection in the evolution of prokaryote genomes.
The schematic plots show:
A. The predicted and observed dependency of protein level selection, measured as dN/dS, on the total number of genes in a genome.
B. The utility hypothesis predicting that the gene gain rate decreases with the genome size because the relative impact on the fitness of a newly gained or lost gene is relatively smaller in larger genomes (diminishing return) whereas the intrinsic loss rate increases with the genome size because there are more genes to lose [101]. Vertical dashed lines around the equilibrium point indicate the range of the genome size expected to be observed in independently isolated genomes of the given species.

