
FIG. 4.
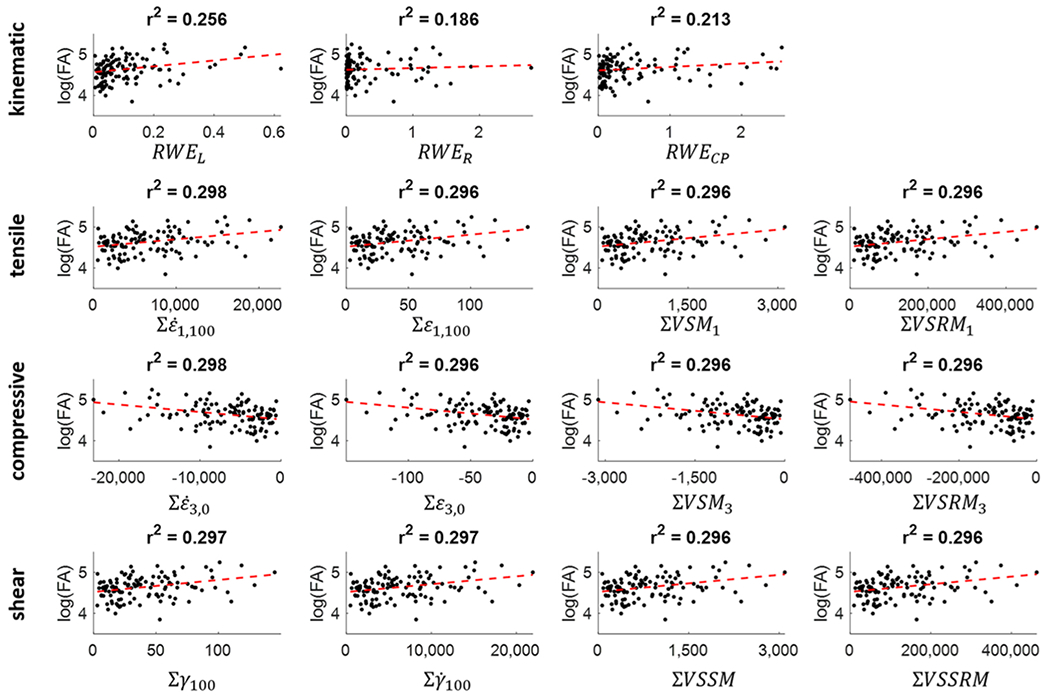
Scatterplots showing the relationships between the number of abnormal FA voxels and the 3 kinematic metrics, as well as the 4 metrics with the strongest association to FA from the tensile, compressive, and shear strain metric groups.
Official websites use .gov
A
.gov website belongs to an official
government organization in the United States.
Secure .gov websites use HTTPS
A lock (
) or https:// means you've safely
connected to the .gov website. Share sensitive
information only on official, secure websites.
Scatterplots showing the relationships between the number of abnormal FA voxels and the 3 kinematic metrics, as well as the 4 metrics with the strongest association to FA from the tensile, compressive, and shear strain metric groups.