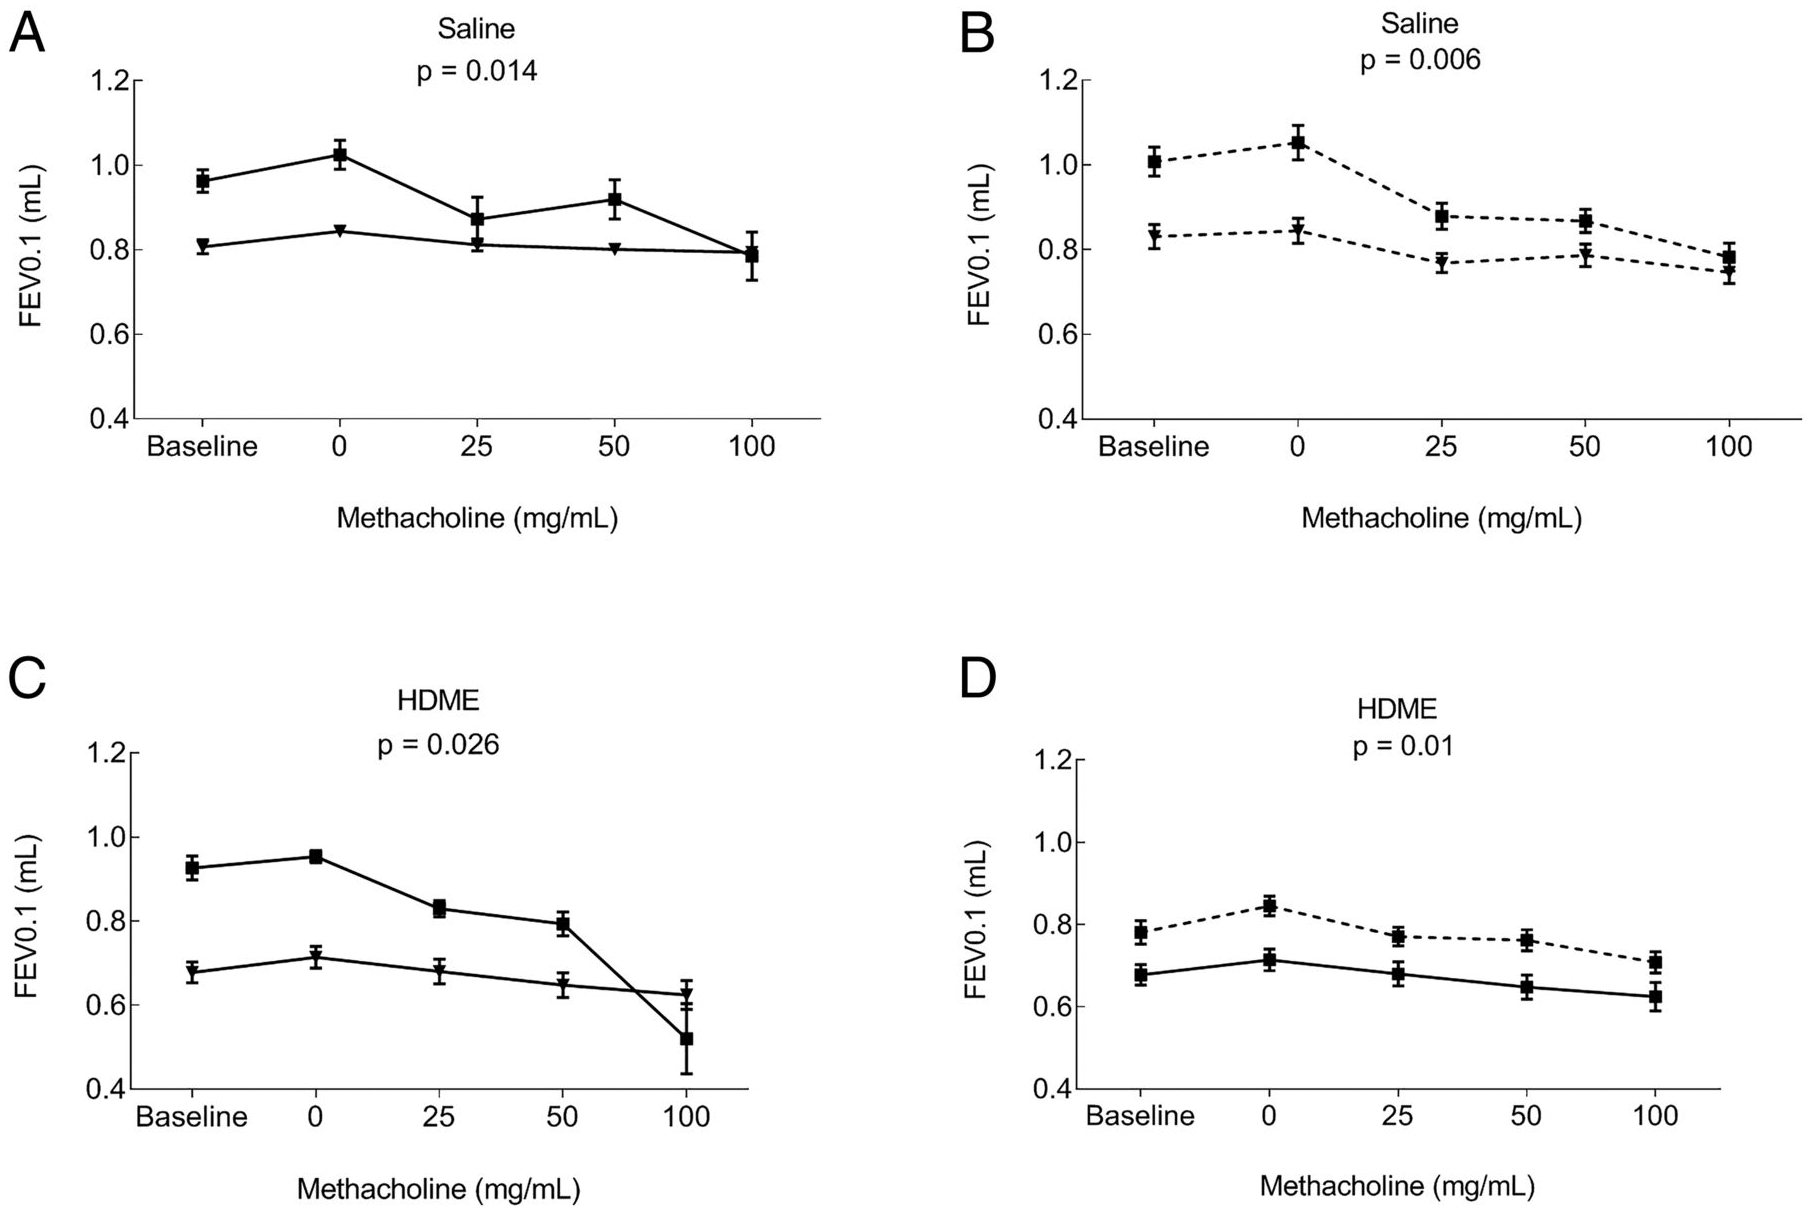
FIGURE 3. NPFE lung function measurements.

Forced expiration volumes were determined in control and HDME groups. FEV0.1 graphs that were significantly different are shown. (A) Comparison of female and male mice in the HB in saline group. (B) Comparison of female and male mice in the LB saline group. (C) Comparison of female and male mice in the HB after allergen exposure. (D) Comparison of female mice between the HB and LB after allergen exposure. Mean ± SE of 10 mice/group is shown.
