
FIGURE 6. Effect of housing and gender on plasma IgE levels.
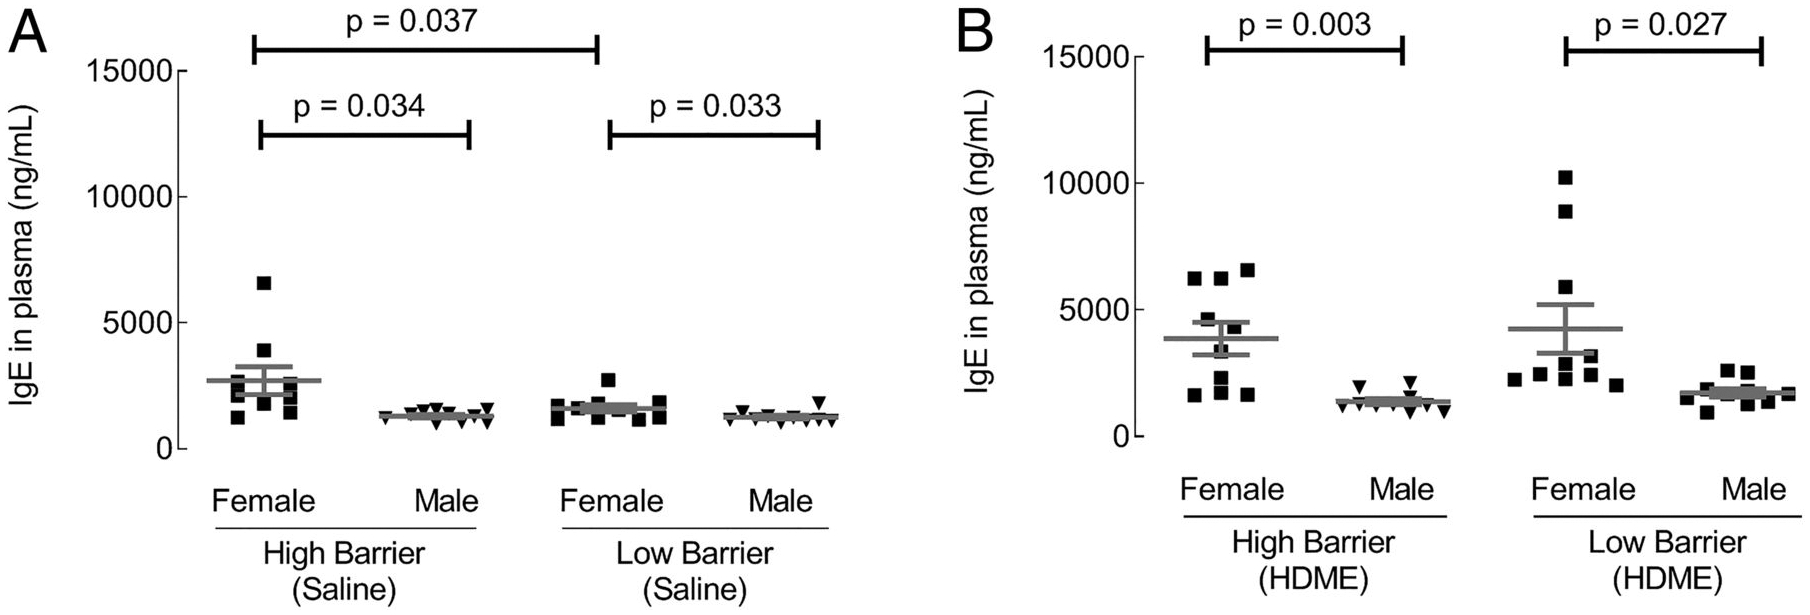
Total IgE levels in plasma were quantified by ELISA. (A and B) IgE levels in saline and HDM exposed groups, respectively. Each dot represents data from one mouse. Ten mice in each group were used.