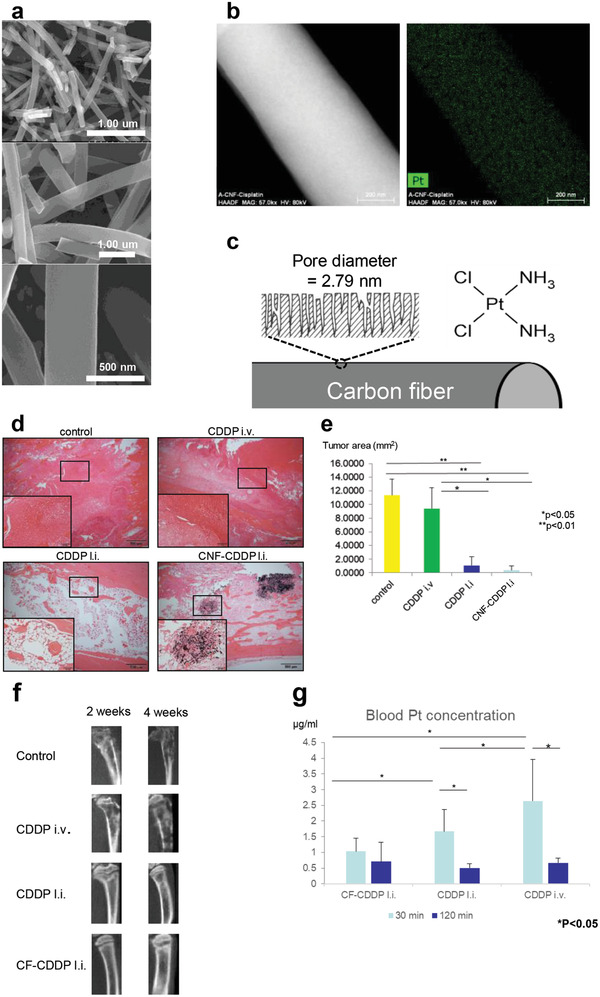
Figure 3.

a) The structure of the CF‐CDDP is identified using a scanning electron microscope (SEM) as a fiber‐entangling columnar structure of 400 nm in diameter and 20–100 µm in length. b) Surface distribution of platinum atoms. Transmission electron microscopy‐energy dispersive X‐ray spectroscopy showed that the platinum atoms are distributed uniformly on the CF surface. c) A large number of pores of 2.79 nm in mean diameter are open on the CF‐CDDP surface, with cisplatin present on the surface and inside pores. d) Tissue from a model of cancer metastasis to the bone prepared by injecting Walker 256 breast cancer cells into the rat tibia is examined in the median sagittal plane using a light microscope. Hematoxylin‐eosin staining. In the control group and CDDP i.v. group, tumor tissue showed high occupation in the marrow cavity. In the CDDP l.i. group, tumor tissue is scant, whereas considerable fatty marrow is seen. In the CNF‐CDDP l.i. group, there are almost no tumor cells or fatty marrow, although remarkable fibrous bone tissue is noted around the CNF. e) Measured area of a cancer cell region in rat tibia tissue in the median sagittal plane (n = 5). Cancer is not suppressed in the CDDP i.v. group. In both the CDDP l.i. group and the CNF‐CDDP l.i. group, an anticancer effect is evident. f) The anticancer effect is evaluated by µCT using tibial images in the median sagittal plane. An anticancer effect is not noted in the CDDP i.v. group, but is detectable in the CDDP l.i. group and the CNF‐CDDP l.i. group. g) Blood platinum concentrations. Administration of Walker 256 breast cancer cells to the rat tibia is followed by local injections of CNF‐CDDP and CDDP and i.v. injection of CDDP 2 days later (n = 5). Blood is collected via the caudal vein 30 and 120 min after drug administration. Platinum atoms in the CDDP composite are measured using atomic absorption spectroscopy. In the CNF‐CDDP l.i. group, post‐dose blood platinum concentration is significantly lower and showed the least change over time. At 120 min post‐dose, no significant differences in blood platinum concentration are found among the groups. Reproduced under the terms of the Creative Commons CC‐BY license.[ 53 ] Copyright 2020, Royal Society of Chemistry.
