
Figure 2:
Maximum Hourly Electricity Demand per Day for Ontario and Outdoor Air Temperature during the Peak Load for June 2018, 2019, and 2020
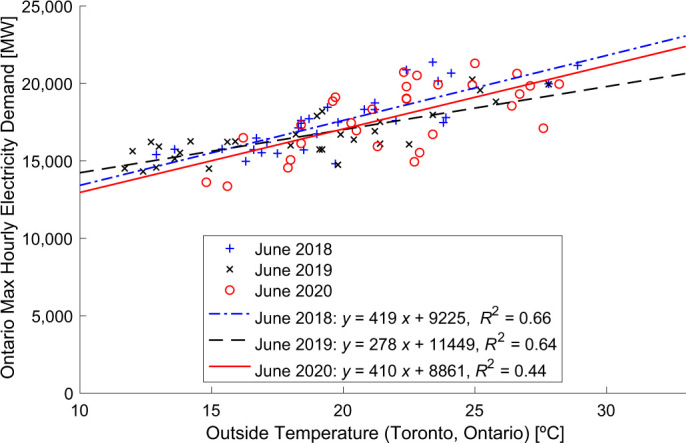
Notes: Temperature is shown for Toronto because this city and the surrounding cities have similar weather and contain approximately two-thirds of Ontario’s population (Ontario 2019; IESO 2020b). The lines were fit with linear least-squares regression.
Sources: Data from IESO (2019, 2020c, 2021) and Canada (2020c).