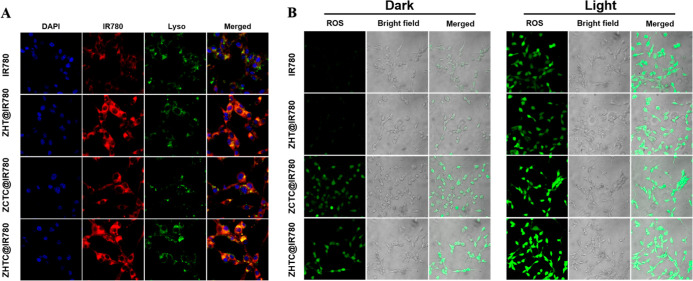
Figure 4.
(A) CLSM image of CT26 cells after 4 h of co-culture with IR780, ZHT@IR780, ZCTC@IR780, and ZHTC@IR780. From left to right in each column are the DAPI fluorescence of the nucleus, IR780 fluorescence, Lyso-Tracker fluorescence of the lysosome, and the superposition of all fluorescence. (B) CLSM observation of CT26 cells’ uptake of small molecules IR780, ZHT@IR780, ZCTC@IR780, and ZHTC@IR780 and the dark control group’s and light experimental group’s ROS production.

