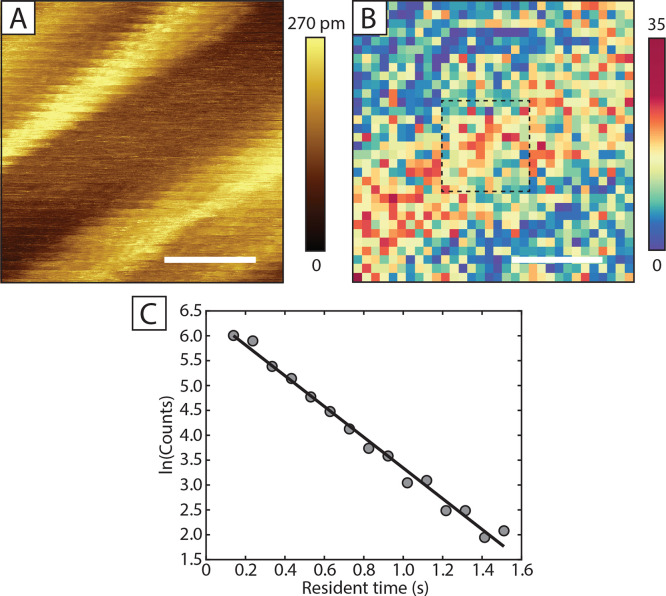
Figure 7.
(A) I(t) grid (15 × 15 nm2, topography), set-points: 500 mV, 80 pA, scale bars in (A,B) correspond to 5 nm. Spectroscopy locations are set at 0.5 nm apart. (B) I(t) heatmap of the detected switches. The dashed square indicates the area from which the distribution of residence time in (C) is taken. (C) Distribution of residence times between the switches. The linear fit corresponds to the formula y = −3.0892x + 6.4324.

