Fig. 1.
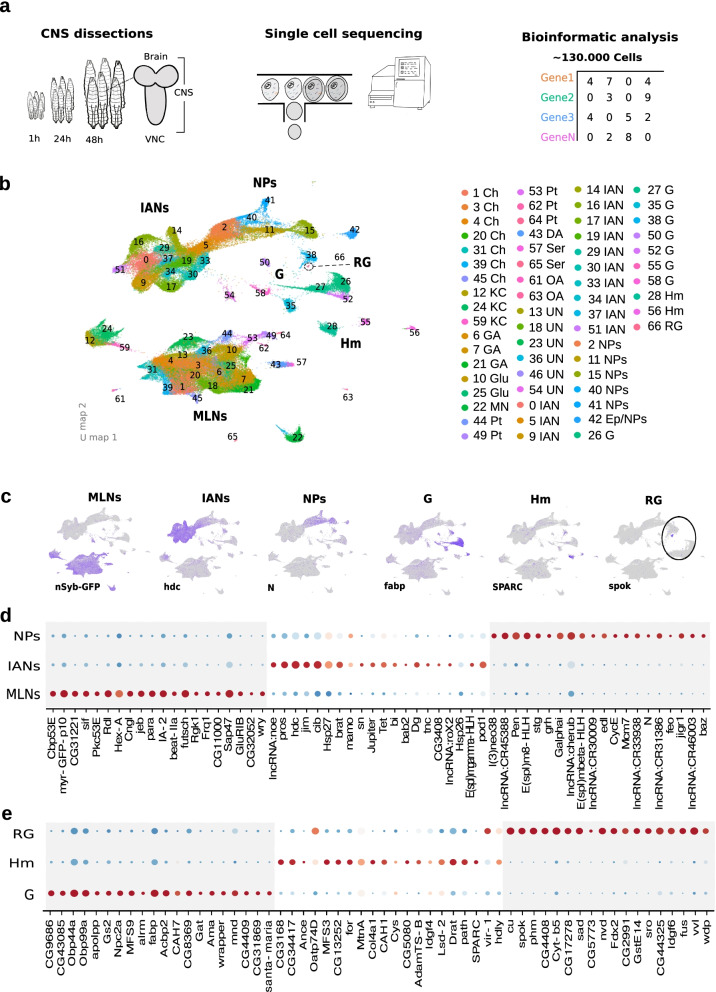
Generation of an integrated single-cell atlas of larval cell types across time and tissues. a Experimental and analysis pipeline summary. In order to generate an expression atlas across time and tissues, we dissected central nervous systems from larvae aged 1 h, 24 and 48 h post-hatching. Given the different neuron numbers present in the brain and ventral nerve cord (VNC), some dissections were exclusively brain or VNC. Refer to Supplementary table 1 for the concrete origin of each sample. Each dissection was treated as an idependent sample. We used 10XGenomics microfluidic technology for single-cell barcoded library generation followed by deep sequencing. We subsequently used Cell Ranger to generate cell by gene count matrices and the R package Seurat to integrate all samples to a common gene expression space allowing their joint analysis. b All-stages, all-tissues integrated UMAP plot. UMAP representation of the CNS cell type diversity discovered after reciprocal-PCA integration, dimensionality reduction and unsupervised clustering with Seurat. In this 2D representation each dot represents a cell and their distribution in space is a function of their similarity in gene expression profile. Each cluster is color and number coded as depicted in the accompanying legend. In order to characterize the cell-type identity resulting from the unsupervised clustering we ran differential gene expression in Seurat. Each cluster identity was annotated after inspection of the presence of previously described cell-type markers. MLNs: Mature Larval Neurons, Ch: Cholinergic Neurons, KC: Kenyon Cells, GA: Gabaergic Neurons, Glu: Glutamatergic Neurons, MN: Motorneurons, Pt: Peptidergic Neurons, DA: Dopaminergic Neurons, Ser: Serotoninergic Neurons, OA: Octopaminergic Neurons, UN: Unknown Neurons, IAN: Immature Adult Neurons, NPs: Neuroprecursors, Ep/NPs: Epithelia/ Neuroprecursor, G: Glia, Hm: Hemocytes, RG: Ring Gland. c Feature plots for the marker distribution separating major CNS cell-types in UMAP space. Mature neurons, i.e. larval functional neurons, express UAS-GFP under the pan-neuronal driver nSyb-GAL4. Immature neurons show high headcase (hdc) expression. Neuro-precursor cells are marked by Notch (N). The different glial classes express fatty acid binding protein (fabp), hemocytes are marked with Secreted protein, acidic, cysteine-rich (SPARC) while the ring gland can be differentiated by spookier (spook) expression. d Dotplots depicting the 20 topmost selectively enriched markers for Mature Larval Neurons, Immature Adult Neurons and Neuro-precursor cells. e Dotplots depicting the 20 topmost selectively enriched markers for Glia, Hemocytes and the ring gland. In each dotplot, the centered mean expression of a gene for each class is calculated and given a color ranging from blue (lowest expression) to red (highest expression), with white corresponding to 0. In this fashion different genes can be compared by their relative expression in the classes depicted irrespective of their absolute expression levels. The diameter of each dot is proportional to the number of cells expressing that gene in the class

