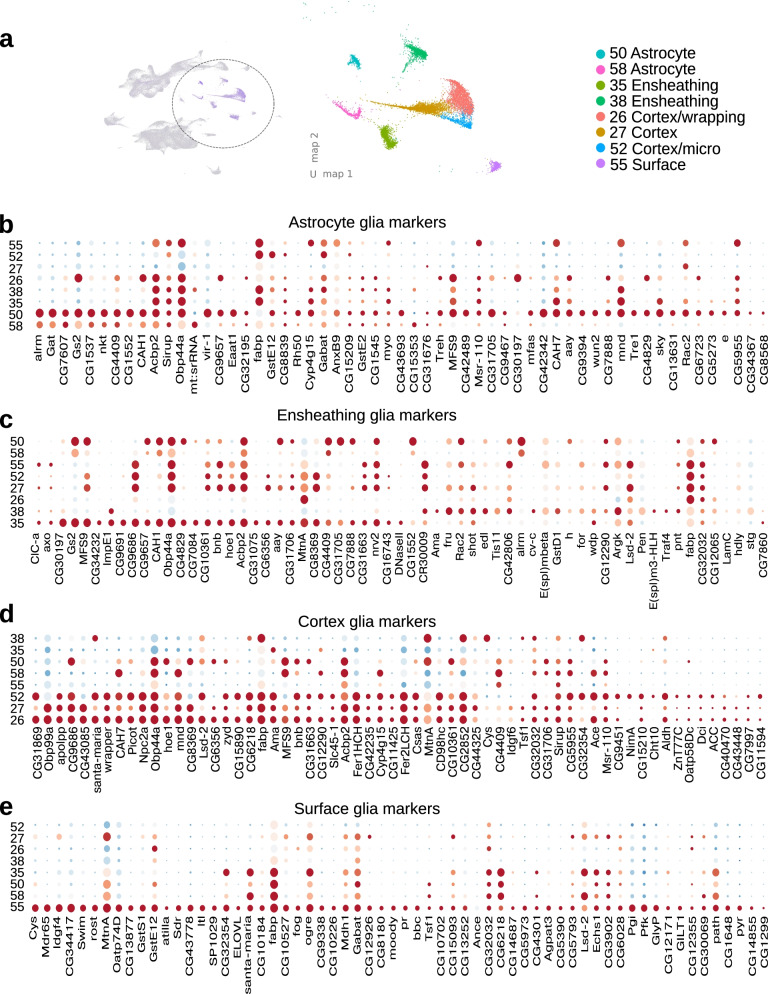
Fig. 4.
Glia subclass analysis. Glial cells are an heterogeneous population composed of morphologically and functionally distinct cells. Accordingly our atlas revealed clearly differentiated clusters occupying the same UMAP subspace owing to their common origin and expression profile. a UMAP plot of the glial subclasses color and number coded. The numbering corresponds to Fig. 1b. Inlet: Fabp positive feature plot indicating the origin of the glial clusters from atlas UMAP. b Atrocyte glial markers dotplot comparing their expression to the rest of glial subclasses. Bottom rows (cluster numbers 58, 50 correspond to Astrocyte glia). The numbering of the clusters is the same as in Fig. 1b. c Ensheathing glial markers dotplot comparing their expression to the rest of glial subclasses. Bottom rows (cluster numbers 35, 38 correspond to Ensheathing glia). The numbering of the clusters is the same as in Fig. 1b. d Cortex glial markers dotplot comparing their expression to the rest of glial subclasses. Bottom rows (cluster numbers 26, 27, 52 correspond to Cortex glia). The numbering of the clusters is the same as in Fig. 1b. e Surface glial markers dotplot comparing their expression to the rest of glial subclasses. Bottom rows (cluster number 55 corresponds to Surface glia). The numbering of the clusters is the same as in Fig. 1b

