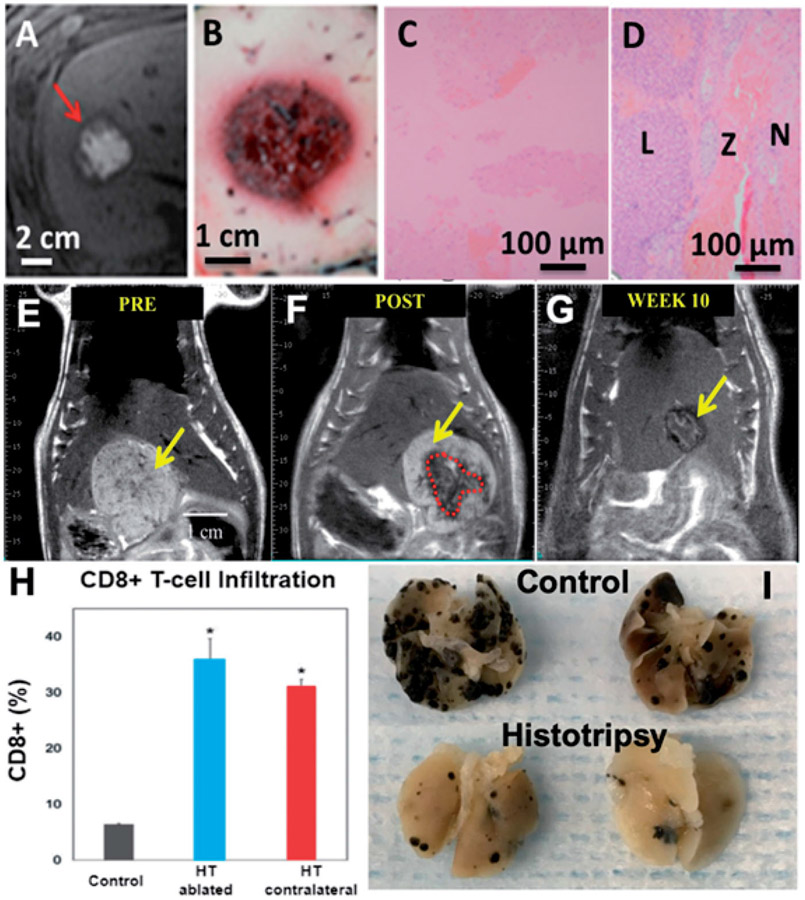
Figure 6.
(A–D) Histotripsy treatment in the in vivo porcine liver. Axial T2-weighted MR images (A) and gross morphology (B) show the spherical ablation volume. (C) H&E slide of (100X) of the center of the ablation zone demonstrates no viable hepatocytes. (D) H&E slide (100X) of the periphery of the ablation shows viable liver (L), necrotic liver (N), and a thin zone of transition (Z). (E–G) MR images of partial histotripsy treatment in a rodent HCC model. (E) The appearance of the original untreated tumor on T2-weighted MRI was hyperintense (yellow arrow). (F) Post histotripsy, the ablation zone demonstrates T2 hypointense signal (red dashed lines). (G) At 12 weeks, only a ~5 mm non-tumoral fibrous tissue zone is detectable on MRI at the original tumor site, indicating near-complete resolution of the ablation zone and tumor. (H–I) Histotripsy induced immune response and abscopal effect (reproduction based on images from ref [39]. (H) FACS analysis of histotripsy-ablated (HT ablated) and contralateral non-ablated tumors (HT abscopal) identified comparable levels of intratumoral CD8+ T cell infiltration that is significantly higher than the untreated control tumors. (I) At gross examination, pulmonary metastases were reduced in mice treated with histotripsy compared to untreated controls.

