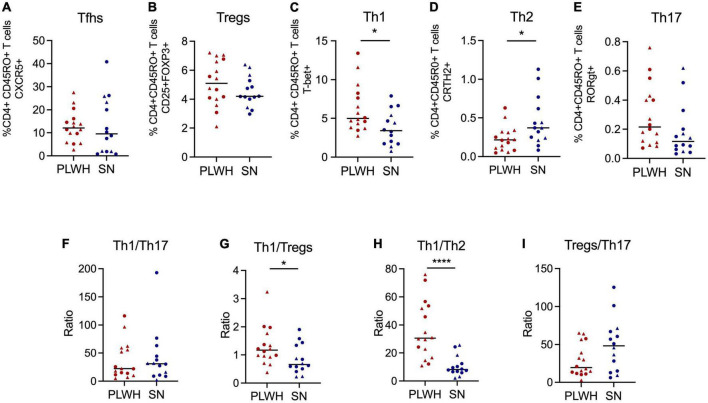
FIGURE 3.
PLWH have increased frequency of Th1 and decreased of Th2 compared to SN. Adenoids and tonsils were obtained from PLWH and SN. Cells from both anatomical sites were pooled to represent the NALT. The frequency (%) of CD4+ T cell subpopulations was assessed by flow cytometry. The frequency of (A) Tfhs (CD3+CD4+CD45RO+CXCR5+), (B) Tregs (CD3+CD4+CD45RO+CD25+FOXP3), (C) Th1 (CD3+CD4+CD45RO+T-bet+), (D) Th2 (CD3+CD4+CD45RO+CRTH2+), and (E) Th17 (CD3+CD4+CD45RO+RORgt+) are shown. The ratios of (F) Th1/Th17, (G) Th1/Tregs, (H) Th1/Th2, and (I) Tregs/Th17 were also determined. Scatter plots were used to present the data. The median is shown by a horizontal line. Each symbol represents one individual. Red triangle: PLWH tonsils, red circle: PLWH adenoids, blue triangle: SN tonsils, and blue circle: SN adenoids. Data was compared using the Wilcoxon Rank Sum test. Only p values < 0.05 are shown in graphs. *p < 0.01; **p < 0.001. %, frequency; CRTH2, chemoattractant receptor-homologous molecule expressed on TH2 cells; FOXP3, forkhead box #P3 protein; HIV, human immunodeficiency virus; PLWH, people living with HIV; NALT, nasopharyngeal-associated lymphoid tissue; RORgt, retinoic acid-related orphan receptor-gammat; SN, seronegative; Tfhs, T follicular helper cells; Th, T helper; and Tregs, T regulatory.

