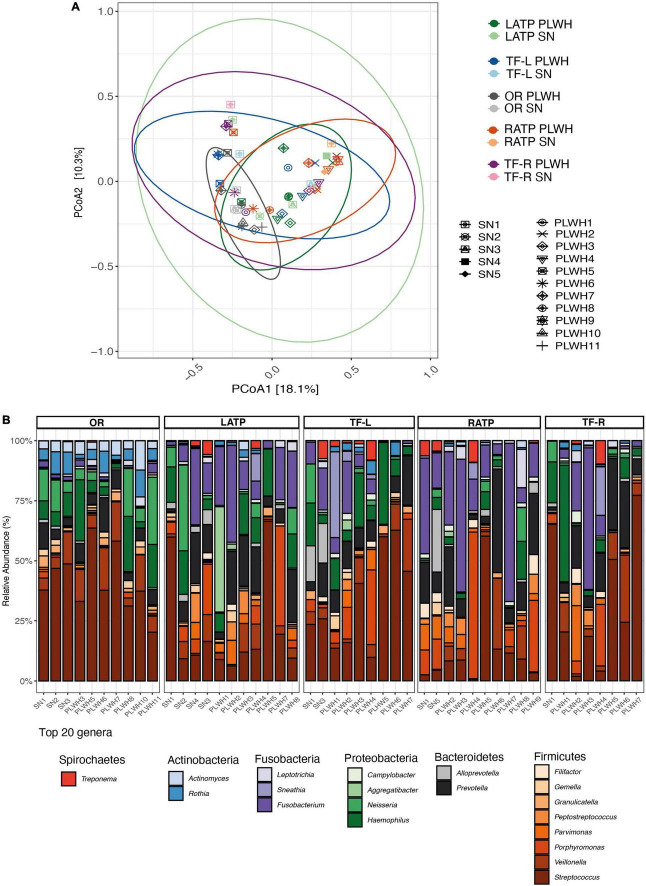
FIGURE 5.
Diversity and bacterial communities of the oropharynx and oral cavity in PLWH and SN. (A) Principal coordinate analysis of Bray-Curtis dissimilarity, constructed from the ASV table. Samples were clustered and painted according to their HIV status and the anatomical site. Samples did not cluster by HIV status (PERMANOVA p = 0.115). Each symbol represents a subject. Ellipses were added to visualize the bacterial communities at each anatomical site by HIV status. Two ellipses (RATP SN and TF-R SN) are missing given the low number of subjects within each group. (B) Taxa barplots showing the taxonomic composition at genus level. Only the top 20 genera are represented, these account for 91.49% of all genera present. Genera are listed from the less abundant to the more abundant within each phylum, and ordered in ascending order (Spirochetes, Actinobacteria, Fusobacteria, Proteobacteria, Bacteroidetes, and Firmicutes). Color bars reflect the phyla they belong to and the intensity of the color their relative abundance, with light colors depicting the least abundant, and the darker colors the more abundant. HIV, human immunodeficiency virus; LATP, left anterior tonsillar pillar; PCoA, principal coordinate analysis; PERMANOVA, permutational multivariate analysis of variance; OR, oral rinse; PLWH, people living with HIV; SN, seronegative; RATP, right anterior tonsillar pillar; TF-L, tonsillar-fossa left; and TF-R, tonsillar fossa-right.

