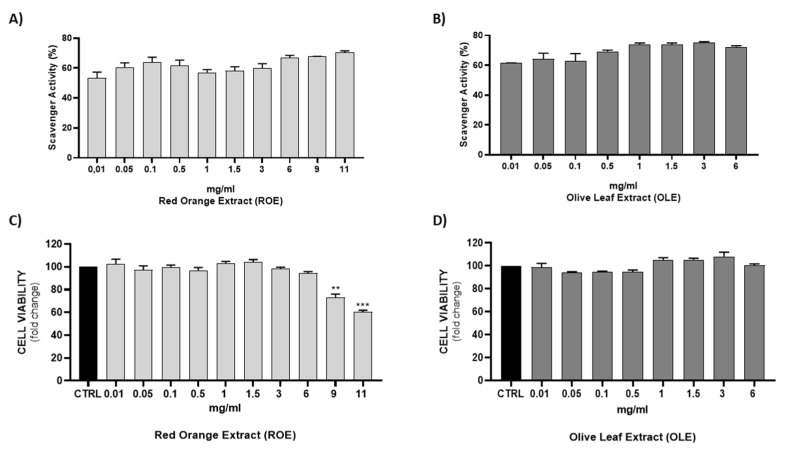
Figure 1.
DPPH radical scavenging activity of (A) ROE and (B) OLE at different concentrations. Results are expressed as a percentage of inhibition. Evaluation of HepG2 cell viability in the absence or presence of (C) ROE and (D) OLE at different concentrations for 72 h. Results are expressed as mean ± SEM. Significant vs CTRL: ** p < 0.005; *** p < 0.0005.

