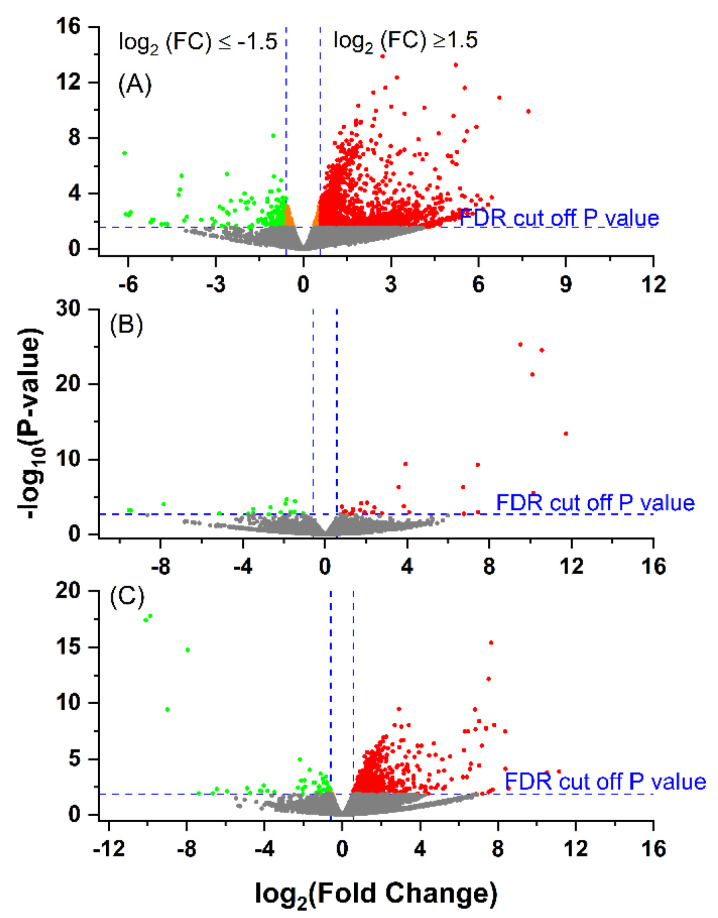
Figure 1.
Volcano plot showing the gene expression profiles following an E. coli mastitis infection between: (A) EARLY (n = 6) and Control (CONT, n = 6); (B) LATE (n = 3) and CONT and (C) EARLY and LATE. The reads were quantified as reads per kilobase million (RPKM) and normalised with trimmed mean and Z-score across all samples. The fold changes were log2-tramsformed. The p-values were transformed with −log10. Cut-off point was p < 0.05 and absolute fold change ≥1.5. The cut-off p (raw) value for false discovery rate control (FDR) at p < 0.05 was 0.0275 for EARLY vs. CONT, 0.0019 for LATE vs. CONT and 0.0134 for EARLY vs. LATE. The green dots indicate significantly down-regulated genes; the red dots indicate significantly up-regulated genes; and the orange dots are the genes with FDR p < 0.05, but with absolute fold changes <1.5.

