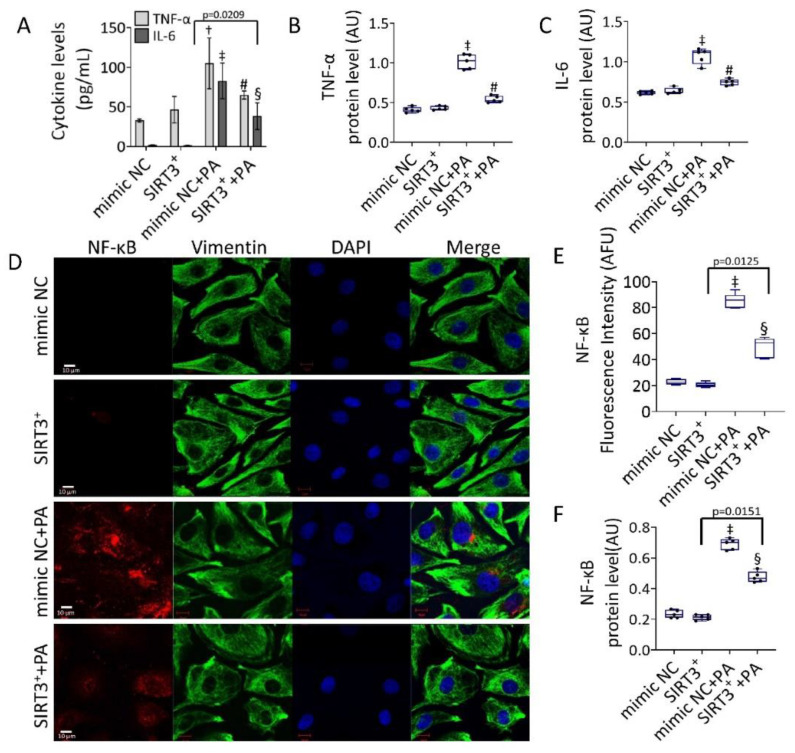
Figure 4.
SIRT3+ counteracted the PA-induced inflammation. (A) Cytokine content and protein level of (B) TNF-α, and (C) IL-6. (D) Representative images of confocal laser scanning microscopy (scale bars = 10 µm). (E) Fluorescence intensity and (F) protein expression levels of NF-κB in EC transfected with mimic Negative Control (mimic NC), SIRT3 mimic (SIRT3+), mimic Negative Control and then exposed to 0.5 mM PA for 48 h (mimic NC+PA) or SIRT3 mimic before 48 h treatment with PA (SIRT3++PA). Fluorescence analysis is reported as boxplots of arbitrary fluorescence units (AFU) of 5 independent experiments. Densitometric immunoblotting study (n = 5) is expressed as arbitrary units (AU). † p < 0.01 vs. mimic NC; ‡ p < 0.001 vs. mimic NC; § p < 0.05 vs. mimic NC+PA; # p < 0.01 vs. mimic NC+PA.

