Figure 6.
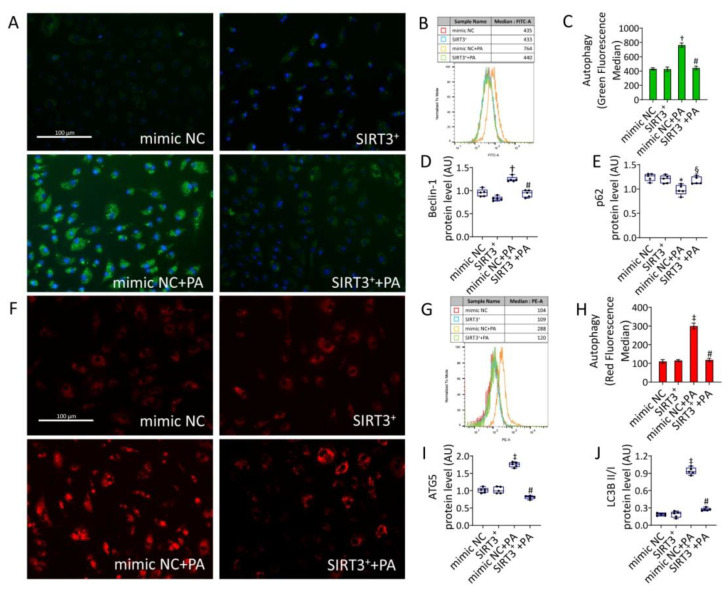
SIRT3+ decreased the PA-induced autophagy. Representative images of fluorescence microscopy and flow cytometry analysis of (A–C) green detection reagent and (F–H) Lysotracker Red, quantified as MFI (scale bars = 100 µm). Western blotting analysis of (D) beclin-1, (E) p62, (I) ATG5, and (J) LC3B II/I in EC transfected with mimic Negative Control (mimic NC), SIRT3 mimic (SIRT3+), mimic Negative Control and then exposed to 0.5 mM PA for 48 h (mimic NC+PA) or SIRT3 mimic before 48 h treatment with PA (SIRT3++PA). Western blotting results (n = 5) are expressed as arbitrary units (AU) and represented as boxplots. † p < 0.01 vs. mimic NC; ‡ p < 0.001 vs. mimic NC; § p < 0.05 vs. mimic NC+PA; # p < 0.01 vs. mimic NC+PA.

