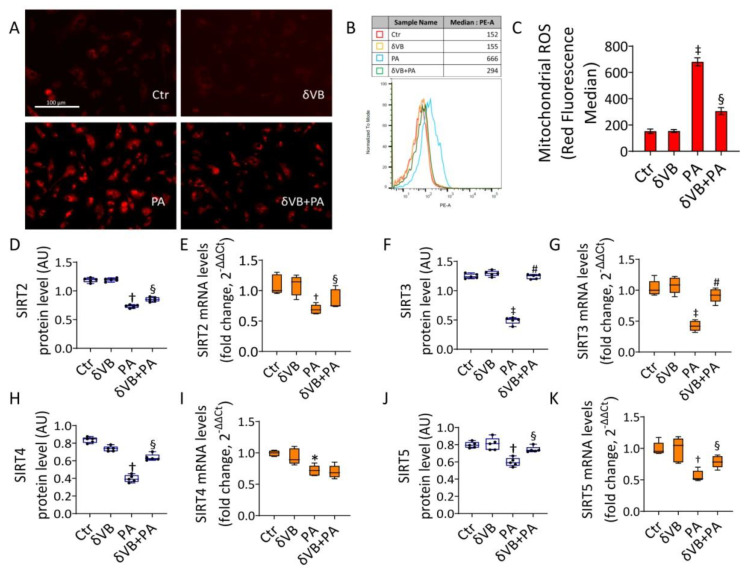
Figure 7.
δVB reduced the PA-induced mitochondrial dysfunction. (A) Representative images by fluorescence microscopy (scale bars = 100 µm) and (B,C) FACS analysis of mitochondrial ROS detection (MFI). Levels of mRNA and immunoblotting analysis of (D,E) SIRT2, (F,G) SIRT3, (H,I) SIRT4, and (J,K) SIRT5 in EC exposed for 48 h to 0.5 mM δVB, 0.5 mM PA (PA), or pretreated for 16 h with δVB before 48 h PA treatment (δVB+PA). Control cells (Ctr) were treated with the corresponding highest volume of HBSS-10 mM Hepes. Western blotting results (n = 5) are expressed as arbitrary units (AU). mRNA levels are reported as floating bars with line representing the median ± SD (n = 3). * p < 0.05 vs. Ctr; † p < 0.01 vs. Ctr; ‡ p < 0.001 vs. Ctr; § p < 0.05 vs. PA; # p < 0.01 vs. PA.

