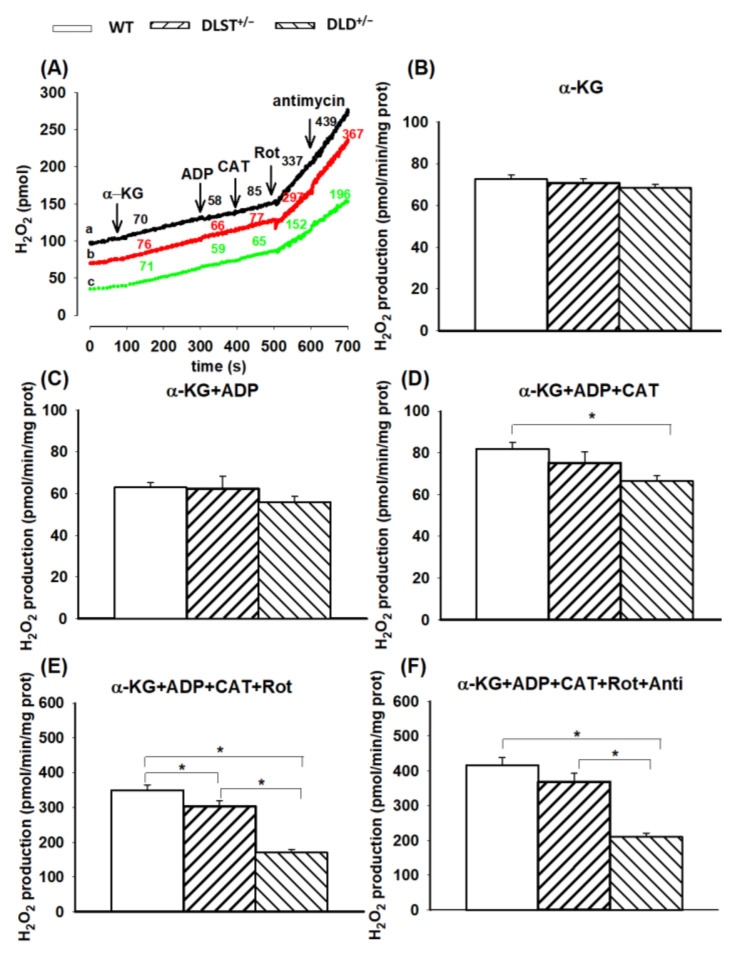
Figure 4.
Hydrogen peroxide production in wild-type and KGDHc-subunit-KO mitochondria respiring on α-ketoglutarate. H2O2 production was measured with the Amplex UltraRed assay as described under Materials and Methods. (A) Traces represent single independent experiments and are offset for clarity. Trace a (black): WT, trace b (red): DLST+/−, trace c (green): DLD+/−. Mitochondria (0.1 mg/mL) were incubated in the standard medium which was followed by the addition of α-KG (5 mM), ADP (2 mM), CAT (2 µM), rotenone (Rot, 250 nM), and antimycin A (1 µM), as indicated. Numbers on the traces represent rates of H2O2 generation expressed in pmol/min/mg protein. H2O2 production was measured in the presence of α-KG (B) and after adding ADP (C–F), CAT (D–F), Rot (E,F) and antimycin A (F). Results are expressed as means of rates of H2O2 production in pmol/min/mg protein ± S.E.M. (N = 4–14). All other representations are as in Figure 1. Statistically, significant differences are indicated by asterisks; * p < 0.05.

