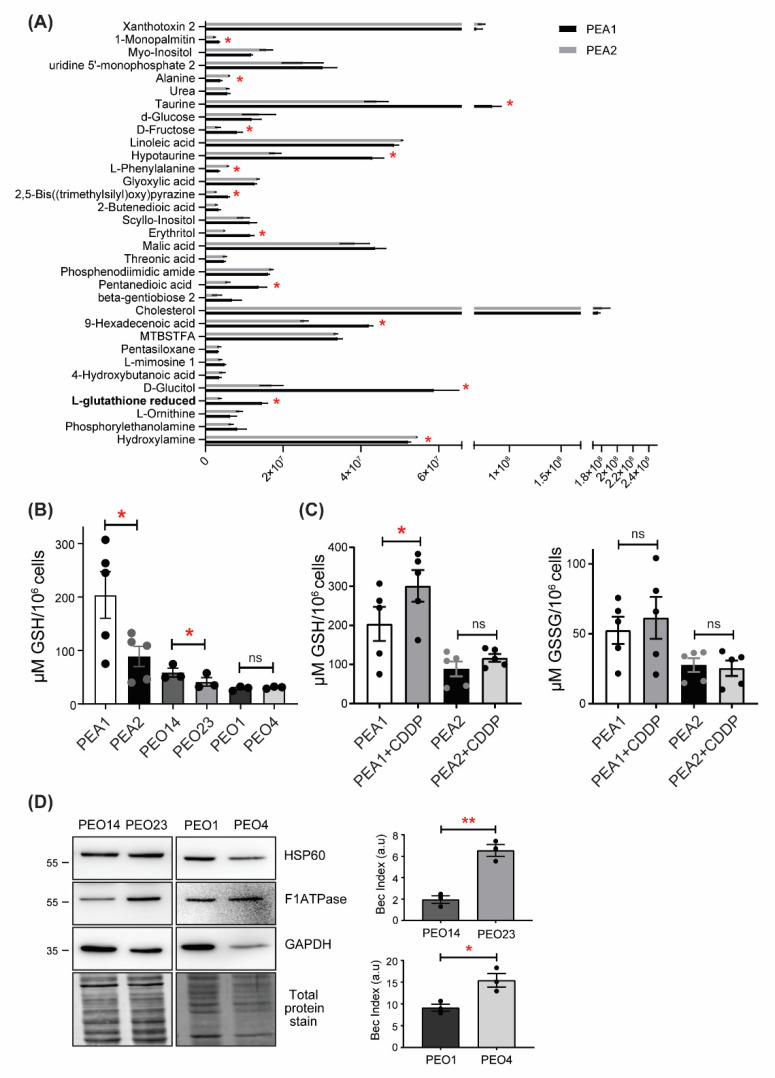
Figure 1.
Cisplatin-resistant high grade serous ovarian cancer (HGSOC) cells show decreased GSH levels. (A) Untargeted metabolomics analyses of the drug sensitive and resistant PEA1/PEA2 cell lines. Data are expressed as mean ± S.E.M (n = 3). Asterisks above the bars represent statistically significant differences (p-value < 0.05) calculated using the Student’s t-test. (B) Determination of GSH levels in cisplatin-sensitive and -resistant OC cells under basal conditions. (C) Determination of GSH and GSSG levels in PEA1 and PEA2 cells treated with 20 μM and 40 μM of cisplatin, respectively, for 30 min. GSH and GSSG levels were measured by a colorimetric assay as outlined in the Materials and Methods. Data are expressed as mean ± S.E.M. from three independent experiments, each with technical duplicates. Significance was assessed by paired Student’s t-test (* p-value < 0.05, ** p-value < 0.01, ns p-value > 0.05). (D) BEC index analysis on PEO1/PEO4 and PEO14/PEO23 cells. Cells were harvested and total protein lysates were immunoblotted with anti-F1ATPase, anti-HSP60, and anti-GAPDH antibodies. Immunoreactive bands were quantified by using ImageJ and BEC index was calculated by the formula F1ATPase/HSP60/GAPDH (see Section 2 Materials and Methods for details). Data are expressed as mean ± S.E.M. from three independent experiments. Significance was assessed by two-tailed Student’s t-test (* p-value < 0.05, ** p-value < 0.01).

