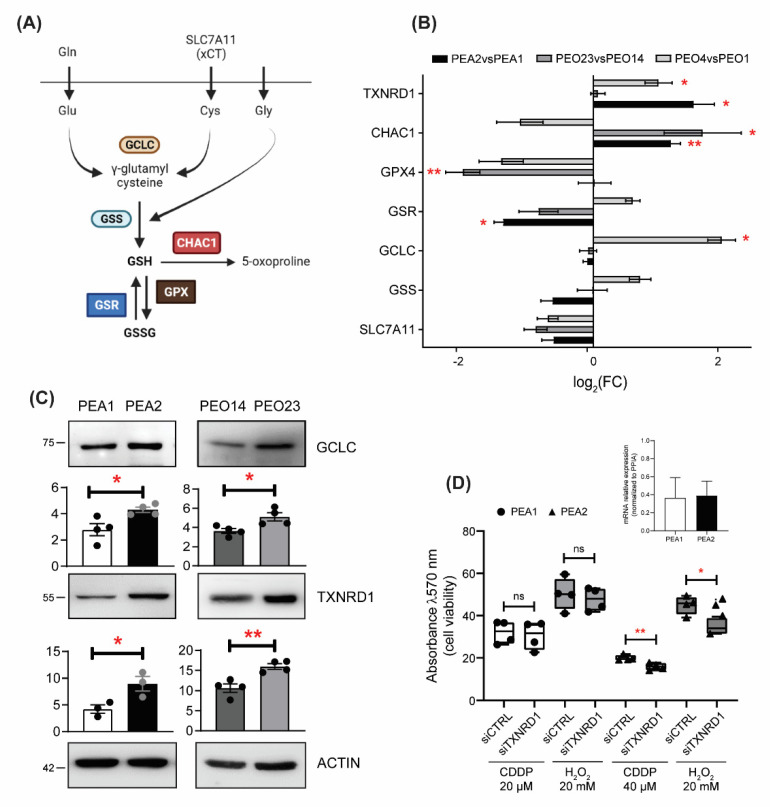
Figure 3.
Drug-resistant HGSOC cells exhibit a remodeling of antioxidant systems. (A) Schematic representation of glutathione synthesis, recycling, and degradation. (B) Real-time RT-PCR analysis of indicated genes in platinum-resistant PEA1, PEO23, and PEO4 cells compared to their matched-sensitive counterparts PEA1, PEO14, and PEO1 cells. Data are expressed as mean ± S.E.M. of −ΔΔCt (log2FC) from four independent experiments with technical triplicates each. Numbers indicate the statistical significance (p-value), based on the Student’s t-tests performed on ΔCt values (significant values highlighted in red). (C) Total lysates obtained from cisplatin-sensitive and -resistant OC cells were separated by SDS-PAGE and immunoblotted with the indicated antibodies. Images are representative of three independent experiments. Bar graphs below each image represent densitometric quantification of bands, expressed as mean ± SEM (n = 3). Significance was assessed by Student’s t-test (* p-value < 0.05, ** p-value < 0.01). (D) Viability assays performed in PEA1 and PEA2 cells following TXNRD1 silencing and treatment with either cisplatin (20 µM and 40 µM, respectively) for 48h or H2O2 (20 mM) for 30 min. Data are expressed as mean ± SEM of four independent experiments, with technical triplicates each. Significance was assessed by Student’s t-test (* p-value < 0.05, ** p-value < 0.01, ns p-value > 0.05). The insert shows the degree of TXNRD1 silencing expressed as fold change compared to the respective control-directed siRNA transfected cells (n = 2).

