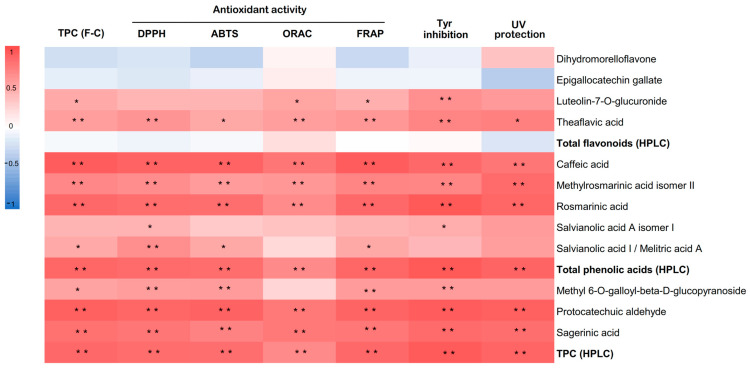
Figure 4.
Heat map corresponding to Pearson’s correlation coefficients between antioxidant activity measured DPPH, ABTS, ORAC, and FRAP, tyrosinase (Tyr) inhibition capacity, UV protection ability, total phenolic contents measured by F-C and HPLC, total flavonoids (HPLC), total phenolic acids (HPLC) and individual phenolic compounds (HPLC). ** Correlation is significant (p < 0.01). * Correlation is significant (p < 0.05).

