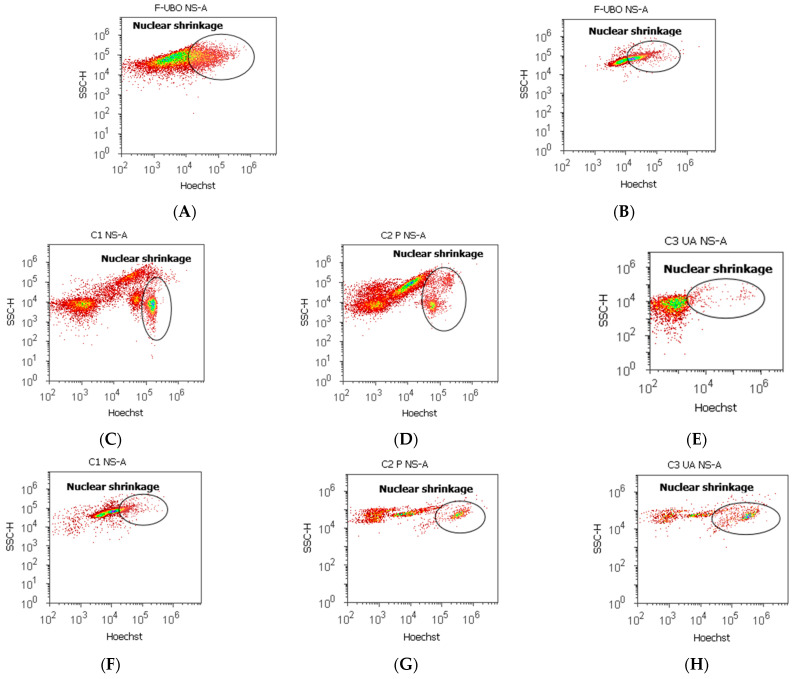
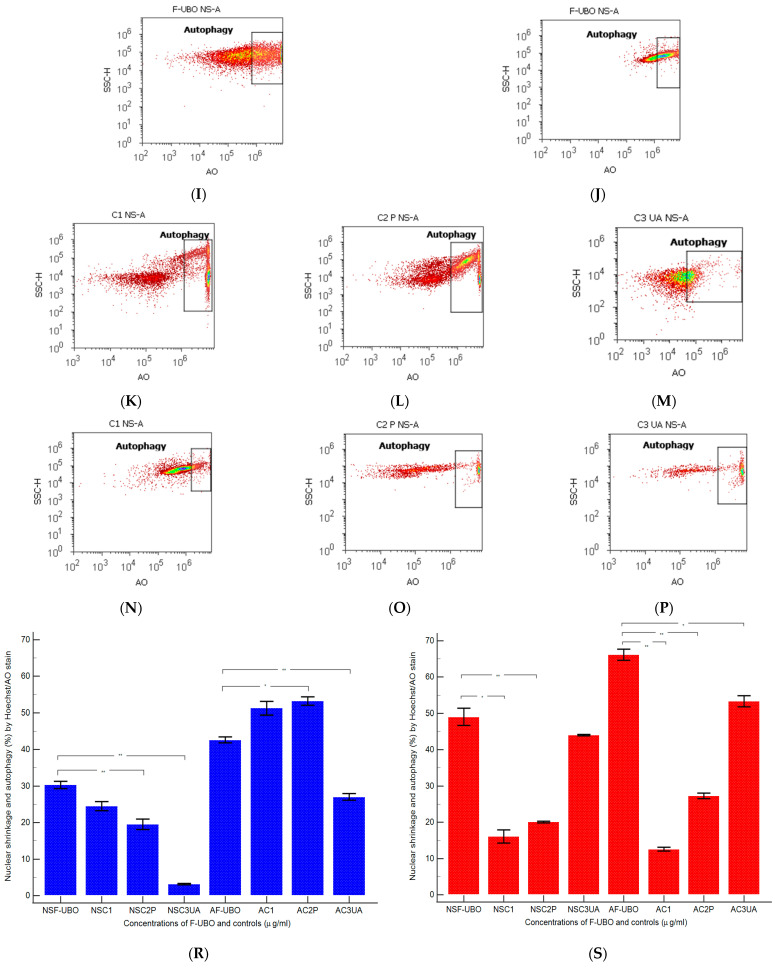
Figure 8.
Nuclear shrinkage (A–H) and lysosomal activity (I–P) after 24 h treatment with F-UBO in normal blood cells (A,C–E,I,K–M) and CLS-354 tumor cells (B,F–H,J,N–P). Hoechst (A–H) and acridine orange (I–P) patterns of F-UBO (A,B,I,J); 1% DMSO negative control (C,F,K,N); 5% P407 positive control (D,G,L,O); 125 µg/mL UA positive control (E,H,M,P); Statistical analysis of nuclear shrinkage and autophagy (R,S) in normal blood cells (R) and CLS-354 tumor cells (S).* p < 0.05 and ** p < 0.01 represent significant statistical differences between controls and sample (F-UBO) made by paired samples t-test; NS—nuclear shrinkage; A—autophagy; F-UBO—bioadhesive oral films loaded with U. barbata extract in canola oil; C1—negative control with 1% dimethyl sulfoxide; C2P—positive control with 5% poloxamer 407; C3UA—positive control with 125 µg/mL usnic acid.


