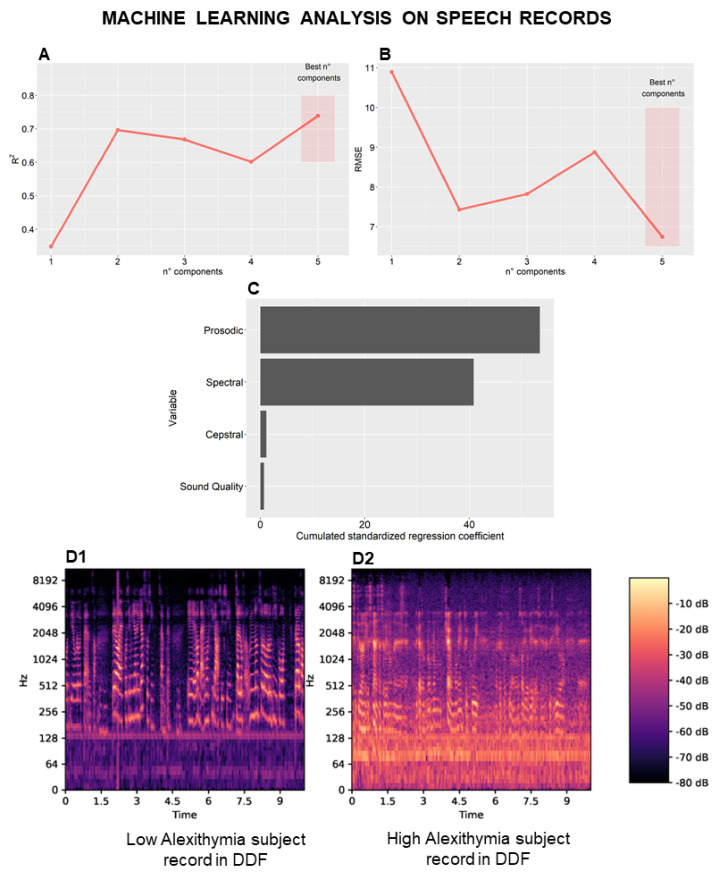
Figure 3.
Machine Learning Analysis on Speech Records. Univariate correlation filtering was applied to select 212 candidate acoustic features belonging to the ComParE feature set and Principal Components Regression (PCR) model with 5 components was selected as the best fitting based on R2 and Root Mean Square Error (RMSE) metrics in Leave-One-Out Cross-Validation (LOOCV) (R2 = 0.74; RMSE = 6.74) (A,B). Relative variable importance was computed over the domains of ComParE low-level descriptors, namely sound quality, spectral, cepstral, and prosodic (C). Representative differences in audio tracks (recorded in responding to an item of Difficulty in Describing Feelings—DDF) from High Alexithymia subjects and Low Alexithymia subjects can be observed in spectrograms (D1,D2).

