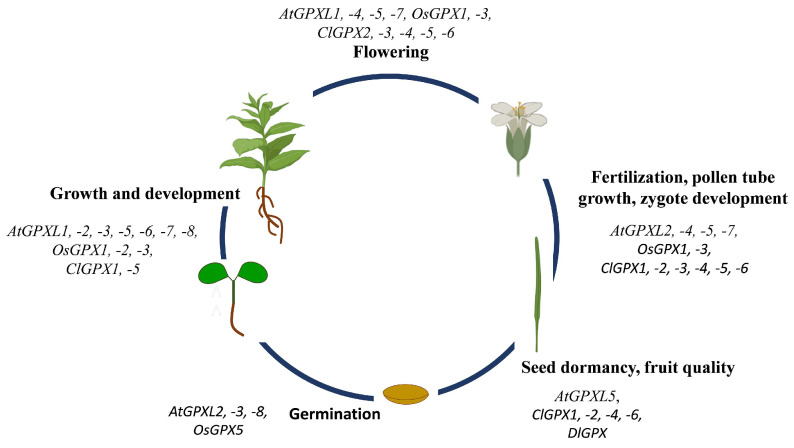
Figure 3.
Schematic representation of involvement of plant GPX(L)s in growth and development in different model and crop plants based on the results published in [32,34,41,56,67,69,87,88]. At: A. thaliana, Cl: C. lanatus, Dl: Dimocarpus longan, Os: O. sativa. Some parts of the figure were created with BioRender.com (accessed on 7 August 2022).

