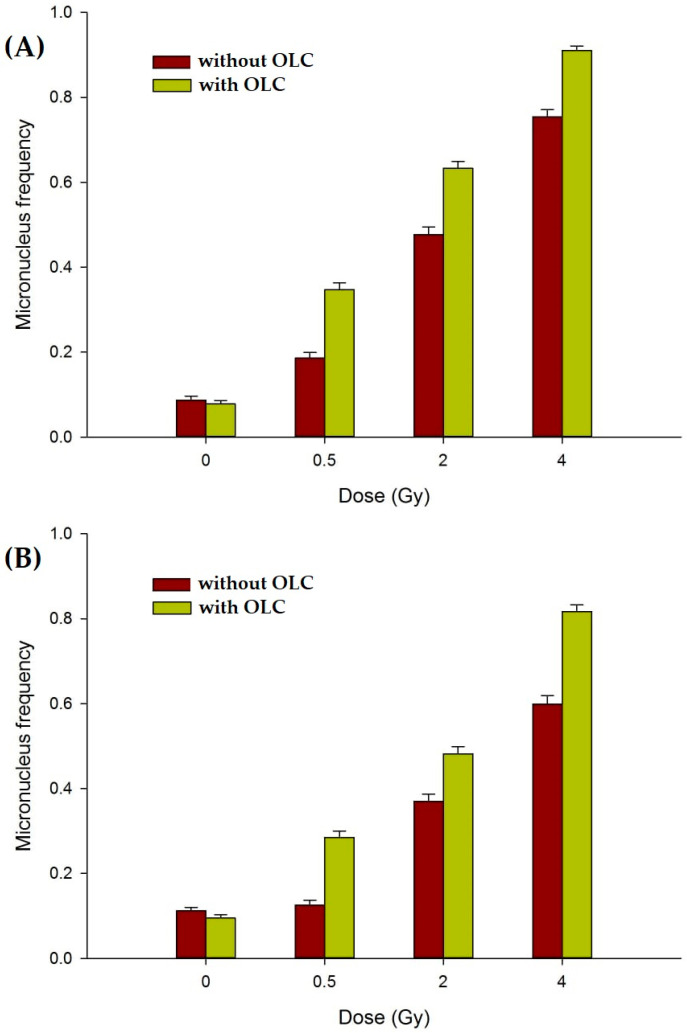
Figure 8.
MN frequency in cancer cell lines: (A) Dose-dependent MN induction in prostate DU145 cancer cells; (B) dose-dependent MN induction in pancreatic PANC-1 cancer cells. Irradiation in the presence of the extract (green bars) causes more DNA damage compared to that measured in non OLC-treated samples (brown bars). Error bars represent SE from at least two independent experiments per cell line.

