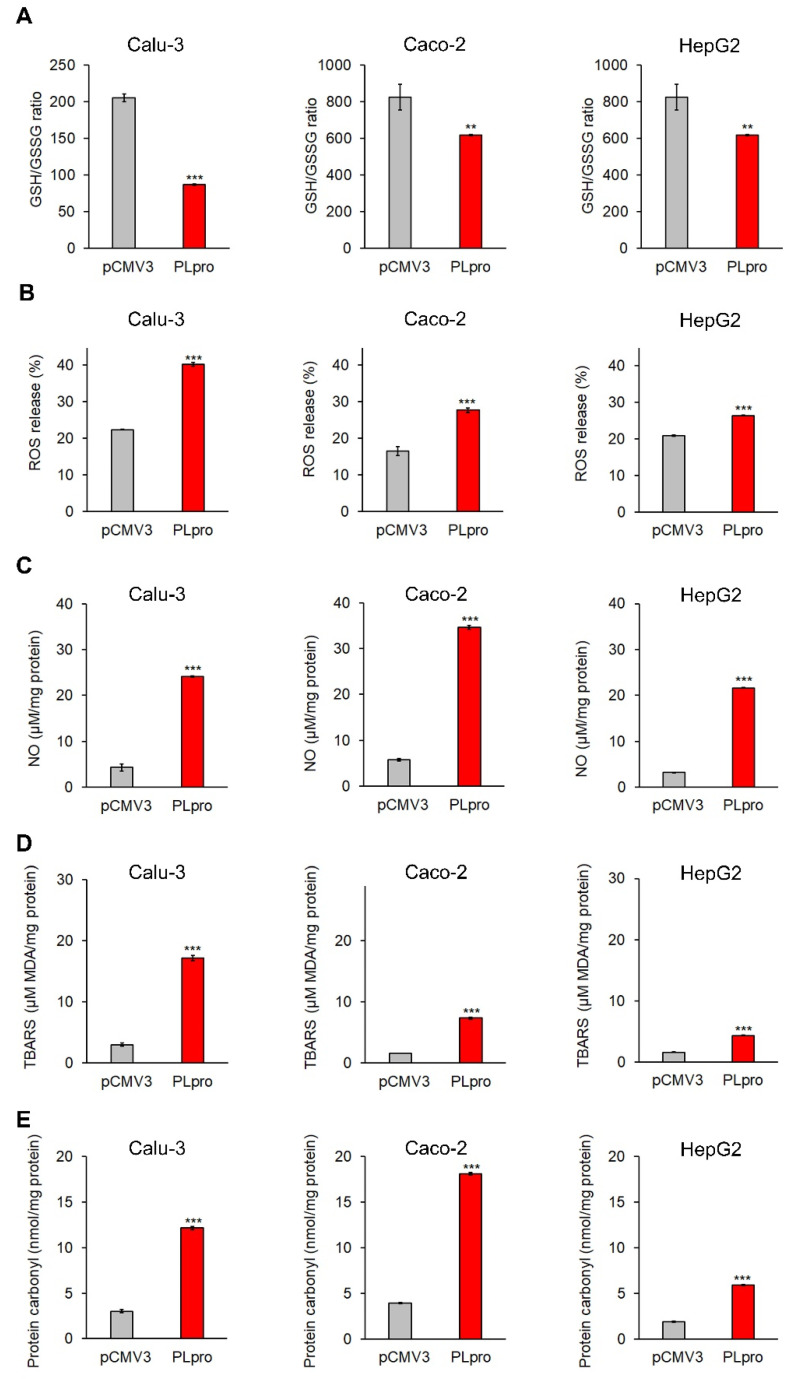
Figure 6.
PLpro expression causes pro-oxidant response in epithelial cells. The histograms report GSH/GSSG ratio (A), percentage of ROS release (B), and levels of NO (C), TBARS (D) and protein carbonyl (E) in Calu-3, Caco-2 and HepG2 cells expressing PLpro (PLpro) compared to empty vector (pCMV3). Values are plotted as mean ± SD of two independent experiments repeated in duplicate. Data were analyzed by 2-tailed t-tests, ** p < 0.01, *** p < 0.001 vs. pCMV3.

