
Figure 6.
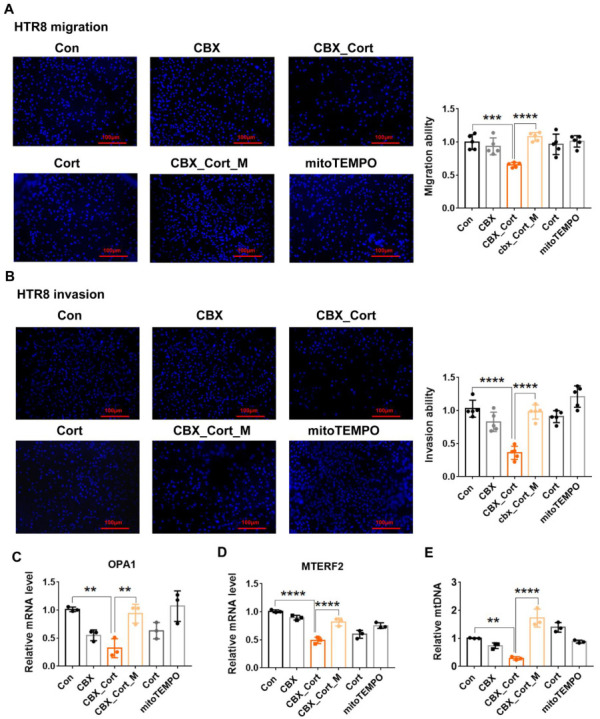
MitoTEMPO treatment improves impaired migration and invasion function, MtDNA maintenance and mitochondria dynamic caused by 11β-HSD2 dysfunction in EVTs. HTR8 cells were treated with cortisol (10−6 M), CBX (10−6 M), mitoTEMPO (10−7 M) or their combination for 24 to 48 h. The cells were then used for the migration and invasion analysis as described in Methods. In some cases, cells were harvested for Q-PCR analysis. (A) the migration function analysis. Left panel: the fluorescence microscopic images show that the cells moved to the underside of the membrane (100 ×. Right panel: histogram shows the cumulative data of migration function. (B) the invasion function analysis. Left panel: the fluorescence microscopic images show that the cells moved to the underside of the membrane (100×). Right panel: histogram shows the cumulative data of invasion function. (C,D) the mRNA levels of MTERF2 and OPA1. (E) mtDNA copy number. n = 3 independent cultures. ** p < 0.01, *** p < 0.001, **** p < 0.0001. Con: control; Cort: cortisol, CBX_Cort: CBX combined with cortisol. CBX_Cort_M: CBX combined with cortisol and mitoTEMPO treatment.