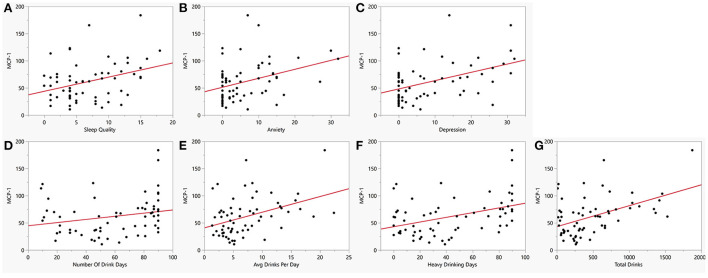
Figure 4.
Bivariate plot of cytokine MCP1 and co-occurring symptoms in AUD. MCP-1 (y-axis) vs. (A) Sleep measured by PSQI (x-axis, R = 0.40, p = 0.004), (B) Anxiety measured by BSA (x-axis, R = 0.39, p = 0.006), (C) Depression measured by MADRS (x-axis, R = 0.44, p = 0.002), (D) Number of drinking days (x-axis, R = 0.42, p = 0.002), (E) Average drinks per day (x-axis, R = 0.51, p < 0.001), (F) Heavy drinking days (x-axis, R = 0.54, p < 0.001), and (G) Total number of drinks (x-axis, R = 0.61, p < 0.001). Red line represents regression line.

