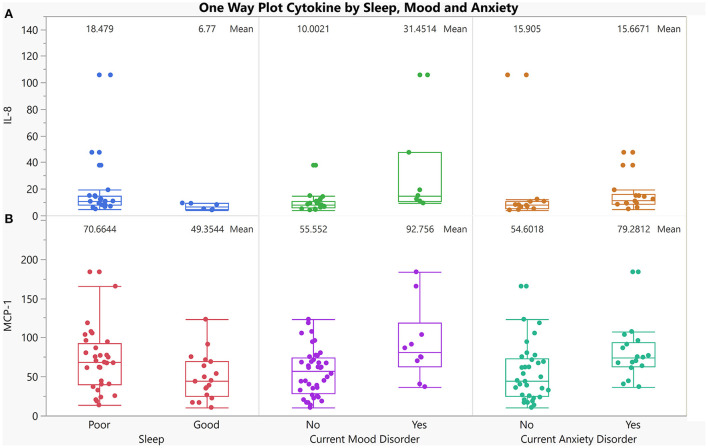
Figure 5.
One-way plot of IL-8, and MCP-1 vs. co-occurring dichotomized symptoms in AUD. X-axis indicates 3 dichotomized symptoms in individuals with AUD who reported having good sleep and those who reported having poor sleep (first panel), individuals with AUD who currently have a mood disorder compared to those who currently do not have a mood disorder (2nd panel), individuals with AUD who currently have an anxiety Disorder compared to those who currently do not have an anxiety disorder (3rd panel). Y-axis is cytokine levels of: (A) IL-8 (p = 0.02, p = 0.003, p = 0.04 respectively for sleep, mood and anxiety), (B) MCP-1 levels (p = 0.05, p = 0.01, p = 0.01 respectively for sleep, mood and anxiety).

