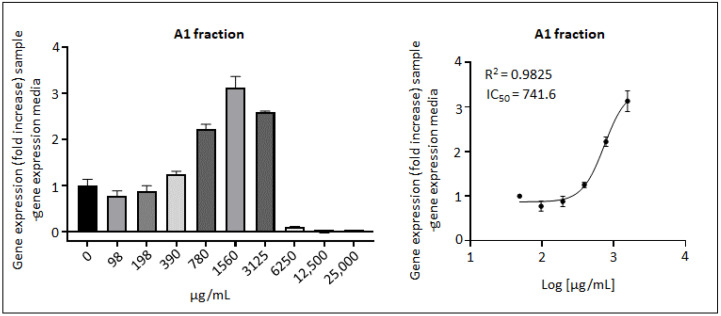
Figure 3.
NRF2/ARE-mediated pathway activation by the fraction A1 in stable ARE-driven luciferase expression HepG2 cells. Cells were treated for 17 h with increasing doses of AE and fractions A1, A2, and A3. Only the A1 fraction showed a dose–response effect. On the left side, results are presented in gene expression fold increase compared with the control (cell culture medium only, gene expression = 1). Values under 1 indicate cytotoxicity effect. The bars are SD for mean relative luminescence units of duplicate. On the right side, the same results are presented as a dose–response curve (EC50: 742 µg/mL, 95% CI: [582.5, 944.9]). Data points correspond to the fold increase for each concentration and bars are SD. EC50 is Efficacy Concentration which leads to half-maximal response. R2 is the coefficient of determination obtained by non-linear regression model fit.

