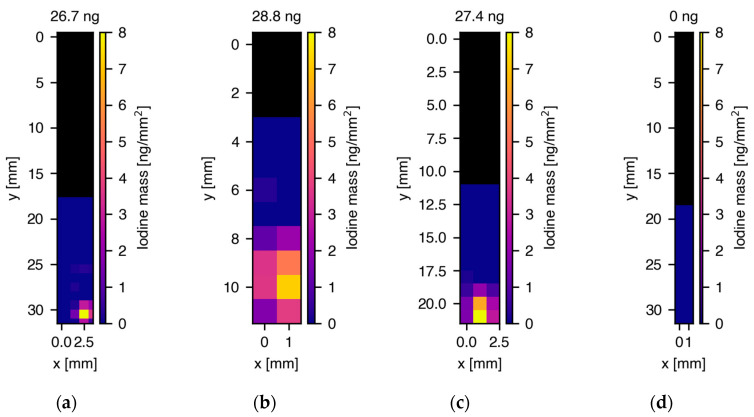
Figure 3.
Two-dimensional maps of the spatial distribution and reconstructed masses of iodine in glass capillaries containing cell pellets treated with 50 M I2-Q10. (a) 26.7 ng total iodine mass in cell pellet from donor 1, (b) 28.8 ng total iodine mass in cell pellet from donor 2, (c) 27.4 ng total iodine mass in cell pellet from donor 3, (d) no iodine signal in untreated cell sample. The maps in (a–c) show a strong localization of iodine in the bottom part of the capillaries where the cell pellet was located in a PBS fluid column. Above the fluid column, the capillaries were empty, indicated by the black color in the XRF maps. Note the different y-axis scales arising from the varying length and thickness of the hand-blown capillaries.

