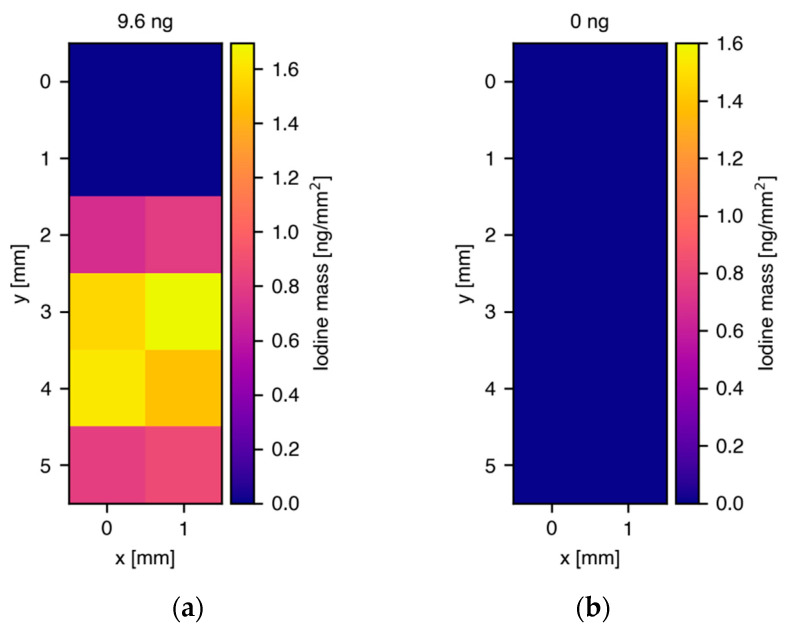
Figure 4.
Two-dimensional maps of the spatial distribution and reconstructed masses of iodine in glass capillaries containing cell pellets treated with iodine of different concentrations. (a) 9.6 ng total iodine mass in cell pellet from donor 2 after treatment with 50 M iodine, (b) no iodine signal in cell pellet from donor 2 after treatment with 8.5 M iodine. Compared with the results for I2-Q10 treatment, the localization was not as strong, indicating a rather low free iodine uptake and/or background signal from iodine attached to cell surfaces that distributes in the cell-surrounding PBS. Note that in this measurement, a smaller region around the cell pellet was scanned, which was different to results presented in Figure 3, where the scan areas were larger.

