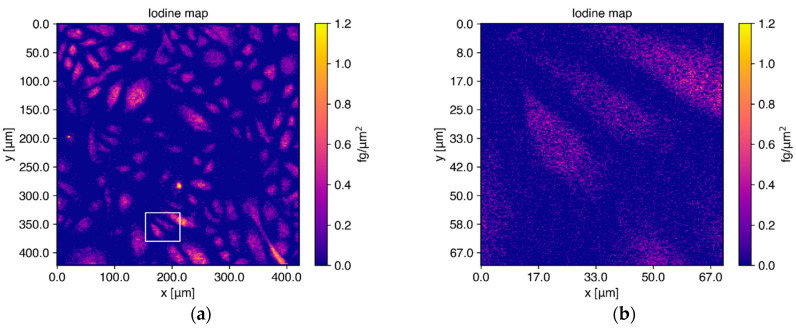
Figure 5.
Elemental maps for iodine reconstructed from single-cell measurements after I2-Q10 treatment. (a) Cells from donor 1 on a silicon nitride membrane were scanned with a 12 keV X-ray beam over an area of 420 × 420 m2. Iodine (as labeled to Q10) is distributed homogeneously inside the cells. (b) Elemental maps of 3 cells from the same membrane scanned again with higher resolution, showing the distributions found in (a) in more detail. The scan area is indicated with a white rectangle in the elemental map shown in (a).

