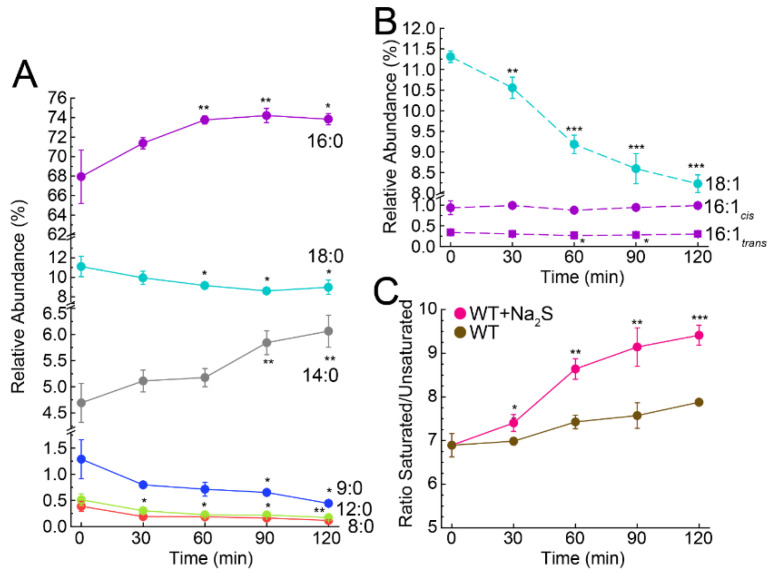
Figure 3.
Fatty acid profiling in WT E. faecalis. Changes in the relative abundance for (A) saturated and (B) unsaturated fatty acids after the addition of exogenous Na2S to cell cultures. (C) The ratio of total saturated to unsaturated fatty acids for Na2S treated cells vs. untreated wild-type cells. Values represent the means ± S.D. derived from the results of biological triplicate experiments, with statistical significance established using a paired t-test relative to the endogenous, time 0 (*** p ≤ 0.001, ** p ≤ 0.01, * p ≤ 0.05).

