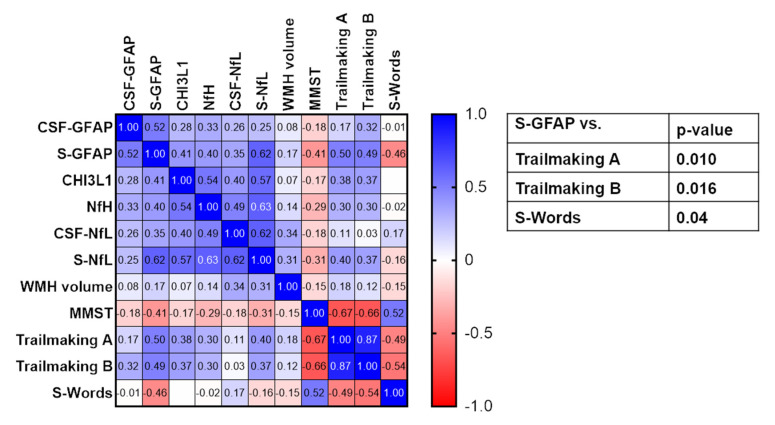
Figure 5.
Correlation matrix of CSF and serum (S) biomarkers and neurocognitive parameters (MMST, Trail Making A and B and S-Words). Numbers in the heat map give the Spearman’s correlation coefficient. p-values in the table only show significant correlations after correction for multiple testing with Bonferroni’s correction.

