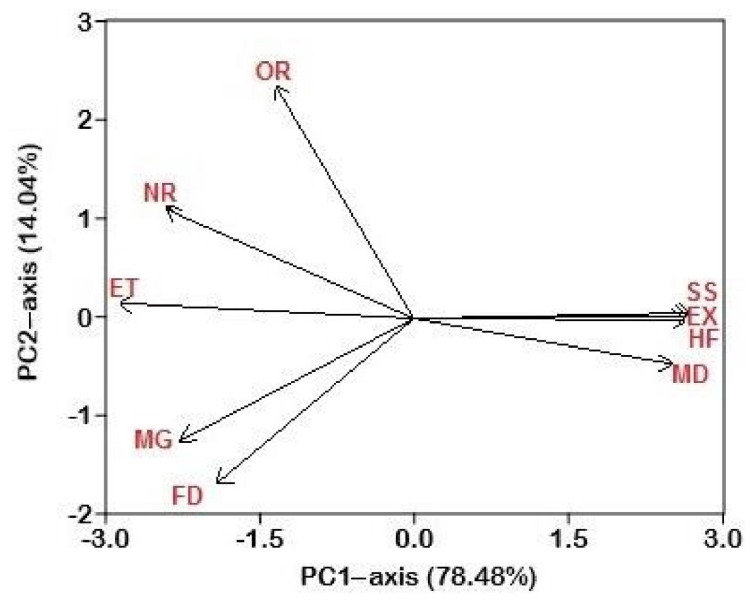
Figure 3.
The principal component analysis (PCA) with the positions of the arrows relative to components 1 and 2, showing how strongly independent variables were correlated with each other. Plot of variables in the PCA conducted with MD (Medicinal), NR (Narratives), SS (Superstitions), CC (Commercial use), TL (Tool), FD (Food), HF (Harmful), MG (Magic), EX (Export), OR (Ornamental), ET (Entertainment), and REL (Religious).

