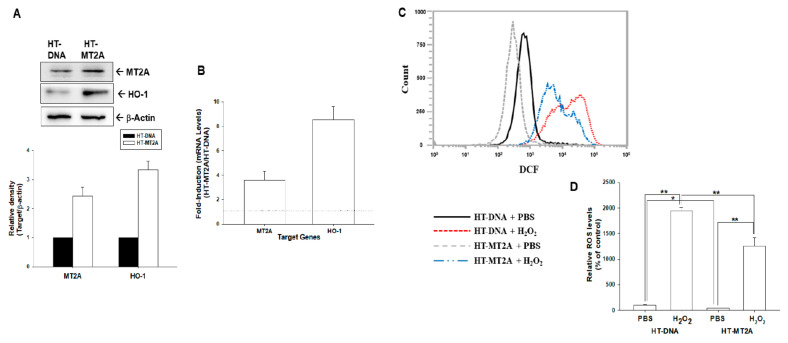
Figure 4.
MT2A downregulated H2O2-induced ROS in bladder carcinoma HT1376 cells. (A) Protein levels of MT2A and HO-1 after overexpression of MT2A in HT1376 cells were examined by immunoblot assays (top). The quantitative data were presented as the intensity of the protein bands of the target proteins/β-actin relative to the mock-overexpressed cells (bottom). (B) Relative fold-induction of mRNA levels of MT2A and HO-1 in HT-MT2A cells compared with HT-DNA cells was evaluated by RT-qPCR assays. ROS levels (C) and quantitative data (D) of HT-DNA and HT-MT2A cells after treatment with or without H2O2 were measured by flow cytometry. * p < 0.05; ** p < 0.01.

