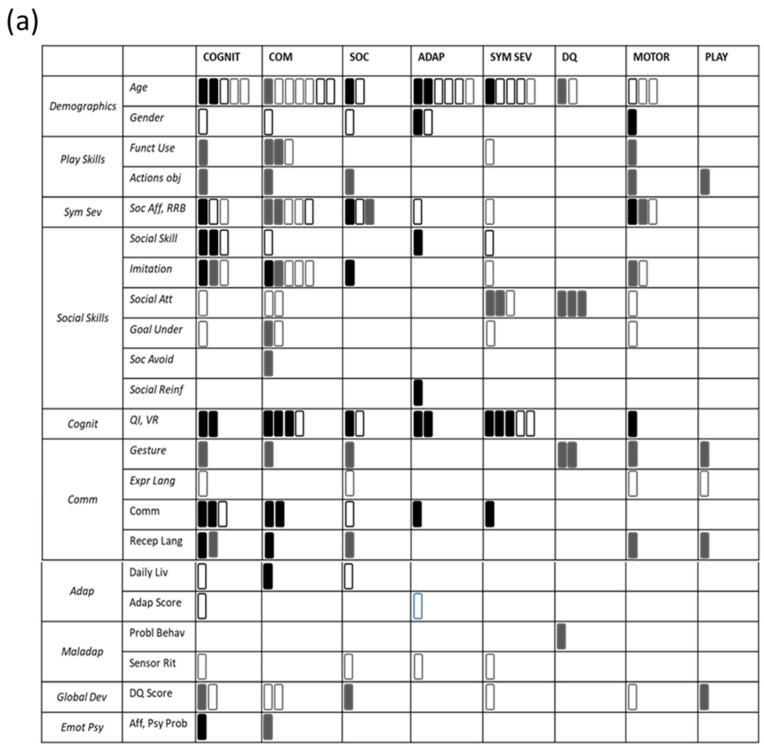
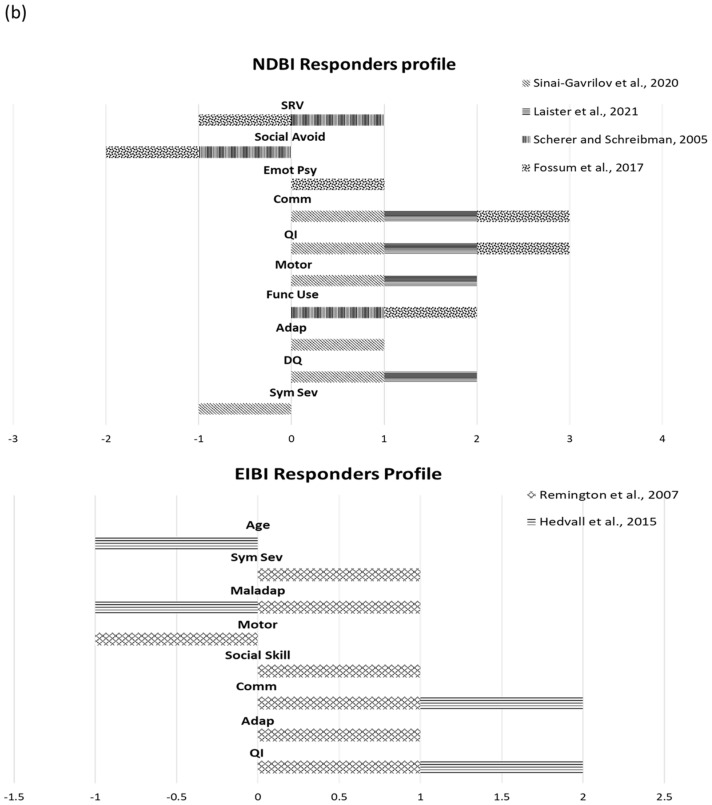
Figure 2.
Panel (a) shows the effects between predictors (in column) and dependent variables (in line). Full rectangles (black for EIBI studies, grey for NDBI studies) indicate that a significant predictive effect has been found for that dependent variable. Empty rectangles (with black outlines for EIBI studies and grey outlines for NDBI studies) indicate that the effect was not significant for that dependent variable. Panel (b) shows responders’ profile for each treatment approach, EIBI on the top and NDBI at the bottom. Solid lines: Hedval et al. [35]; Rhombus texture: Remington et al. [44]; Dotted texture: Fossum et al. [31]; Horizontal lines: Laister et al. [36]; Vertical lines: Sherer and Schreibman [37]; Diagonal lines: Sinai-Gavrilov et al. [27].


