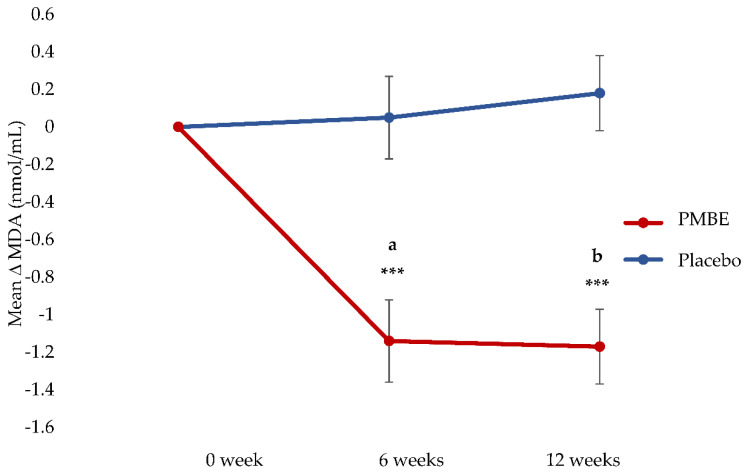
Figure 2.
Mean change in MDA concentrations (with standard error bars) over time in the placebo and PMBE groups. Significant change from baseline is indicated by *** p < 0.0001; (a), mean change between PMBE group and placebo group at 6 weeks was statistically significant (−1.23 nmol/mL, 95% CI −1.84 to −0.62, p < 0.0001). (b), mean change between PMBE group and placebo group at 12 weeks was statistically significant (−1.53 nmol/mL, 95% CI −2.09 to −0.98, p < 0.0001).

