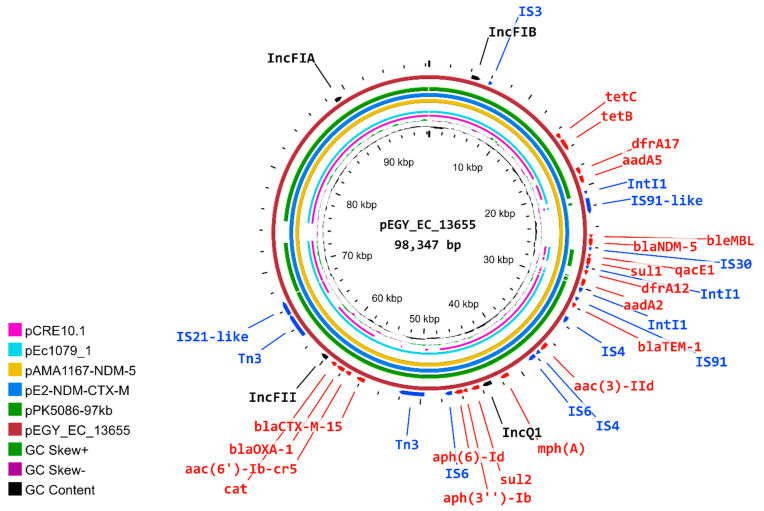
Figure 5.
Circular comparison of pEGY_EC_13655 with the most similar IncFIA/IncFIB/IncFII/IncQ1 plasmids carrying ESBL-encoding genes from the NCBI database generated by CGView Server. The innermost circles show the plasmid coordinates, GC content (black), and GC skew (dark green and magenta). Circles from inside to outside correspond to the coding sequencing region of pCRE10.1 (CP034401.1), pEc1079_1 (CP081307.1), pAMA1167-NDM-5 (CP024805.1), pE2-NDM-CTX-M (CP048916.1), pPK5086-97kb (CP080372.1), and pEGY_EC_13655 (ON707124). Genomic regions covered by BLASTn are represented by a solid color in concentric rings, whereas white gaps indicate genomic regions not covered by BLASTn. Antibiotic-resistance genes (ARGs) are illustrated in red color, while insertion sequences and transposases are shown in blue color.

