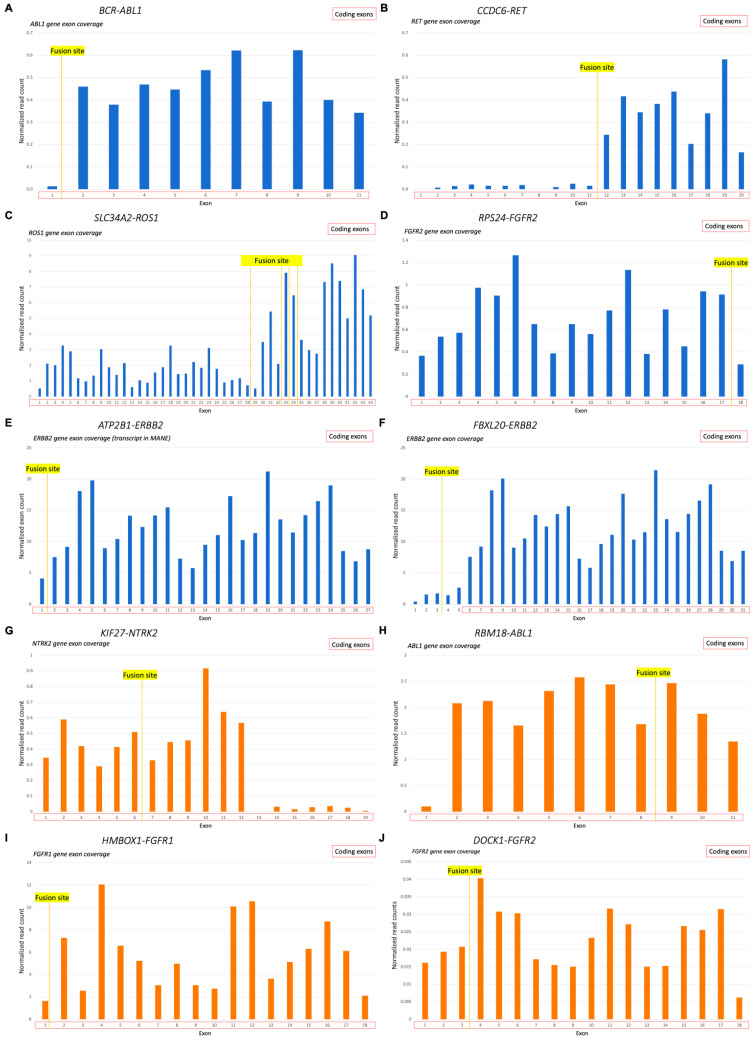
Figure 5.
The 3′ fusion partner gene exon coverage, investigated for the 3′RTK fusion transcripts: (A) length-normalized RNAseq reads coverage of ABL1 gene in sample AL98 (BCR-ABL1 fusion); (B) length-normalized RNAseq reads coverage of RET gene in sample FS1 (CCDC6-RET fusion); (C) length-normalized RNAseq reads coverage of ROS1 gene in sample LuC46 (SLC34A2-ROS1 fusion, all variants); (D) length-normalized RNAseq reads coverage of FGFR2 gene in sample OC11 (RPS24-FGFR2 fusion); (E) length-normalized RNAseq reads coverage of ERBB2 gene in sample BC105 (ATP2B1-ERBB2 fusion); (F) length-normalized RNAseq reads coverage of ERBB2 gene in sample BC105 (FBXL20-ERBB2 fusion); (G) length-normalized RNAseq reads coverage of NTRK2 gene in sample LuC11 (KIF27-NTRK2 fusion); (H) length-normalized RNAseq reads coverage of ABL1 gene in sample J11 (RBM18-ABL1 fusion); (I) length-normalized RNAseq reads coverage of FGFR1 gene in sample EpS1 (HMBOX1-FGFR1 fusion); (J) length-normalized RNAseq reads coverage of FGFR2 gene in sample PC24 (DOCK1-FGFR2 fusion). (A–F), verified fusions (blue); (G–J), non-verified fusions (orange).

